PremiumGuardHQ
Topic

Options pricing

10 entries filed under this topic
14 min read
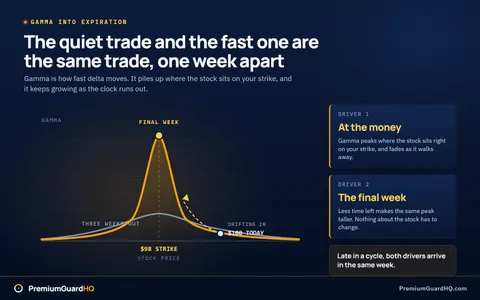
Gamma plotted across strikes for a stock at 100 dollars with a 98 strike marked: the final-week curve spikes into a tall amber peak right at the strike while the three-weeks-out curve stays low and flat across the same strikes, with the two drivers labelled at the money and final week.

What is gamma in options? The risk that turns a quiet wheel trade into a fast one

Gamma measures how fast delta moves. Why it spikes at the money in the final week, what short gamma does to a wheel position, and how to read it.
PremiumGuard Research Deskoptions pricingwheel strategyassignment
22 min read
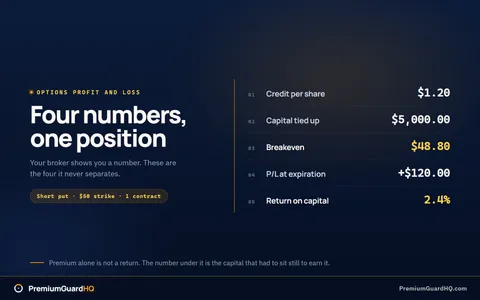
Dark navy card titled Four numbers, one position, listing a short 50 strike put sold for 1.20 with credit per share 1.20, capital tied up 5,000.00, breakeven 48.80, profit at expiration 120.00 and return on capital 2.4 percent.

How to calculate options profit and loss the right way

How to calculate options profit: true cost basis, breakeven, dollars at expiration, and annualized return on capital for calls, puts and the wheel.
PremiumGuard Research Deskoptions pricingcost basiswheel strategy
11 min read
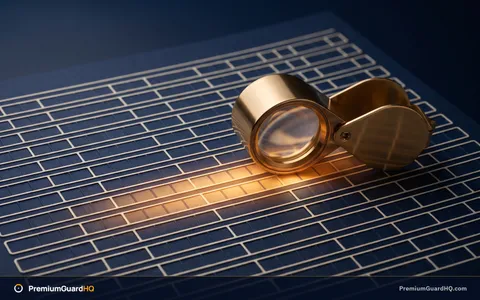
Editorial illustration of a brass jeweler's loupe resting on a dense navy grid of blank ledger cells, with a single row beneath the lens lit amber, representing reading one row of an options chain closely.

How to read an options chain: a row-by-row SPY walkthrough

Learn how to read an options chain row by row: bid, ask, spread, volume, open interest and delta, using SPY as the worked example.
PremiumGuard Research Deskoptions pricingwheel strategy
14 min read
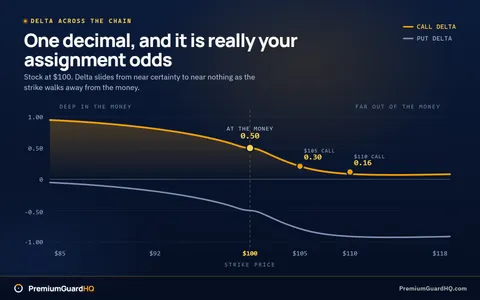
Delta plotted across strikes for a stock at 100 dollars, with call delta running from near 1.00 deep in the money down through 0.50 at the money to near 0.00 far out of the money, and put delta mirrored below the axis from near 0.00 down to negative 1.00, with the at-the-money coin-flip point marked at 0.50 and negative 0.50.

What is delta? The number that tells you your assignment odds

Delta gives premium sellers a rough read on assignment odds. How to read it on a chain, why it moves, and what it costs you to sell far out of the money.
PremiumGuard Research Deskoptions pricingassignmentwheel strategy
11 min read
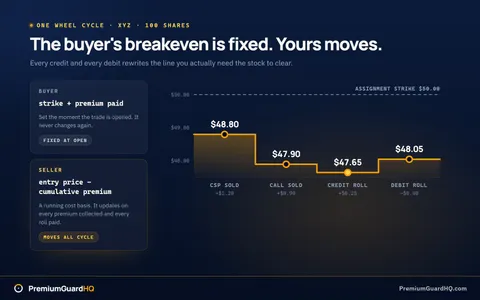
A seller's breakeven plotted as a stepped line across one wheel cycle, dropping from 48.80 dollars after the cash-secured put to 47.90 after the covered call and 47.65 after a credit roll, then rising to 48.05 after a debit roll, all held below a flat dashed reference line at the 50.00 dollar assignment strike, with the buyer's fixed strike-plus-premium formula shown alongside for contrast.

What does breakeven mean in options? Buyer math vs the seller's moving line

What does breakeven mean in options? Buyers get one formula. Sellers running the wheel track a cost basis line that moves with every premium and every roll.
PremiumGuard Research Deskoptions pricingcost basiswheel strategy
15 min read
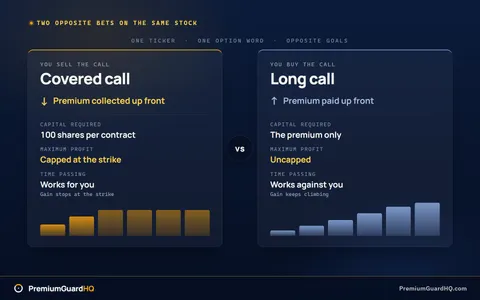
Covered call and long call compared side by side, one showing premium collected up front with a capped gain at the strike, the other showing premium paid up front with uncapped upside.

Covered call vs long call: which options trade actually fits your goal

Two opposite bets on the same stock. Compare payoffs, capital, time decay and management to decide whether you are chasing income or chasing upside.
PremiumGuard Research Deskcovered callsoptions pricingincome
22 min read
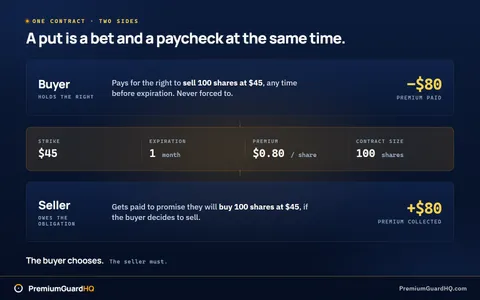
One put contract shown from both sides at once: the buyer paying eighty dollars for the right to sell one hundred shares at a forty-five dollar strike, and the seller collecting that same eighty dollars against the obligation to buy those shares if asked.

What is a put option? The bet and the paycheck, explained

What a put option is on both sides: the buyer's right to sell, the seller's obligation to buy, payoff and breakeven math, and what assignment means.
PremiumGuard Research Deskoptions pricingassignmentincome
13 min read
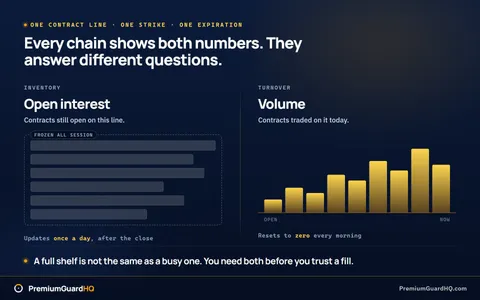
Open interest shown as standing contract inventory that updates once a day after the close, set beside volume shown as today's turnover resetting to zero every morning, the two numbers an options chain reports for the same contract line.

Open interest vs volume: the liquidity check before you sell a put

What open interest measures, when it updates, and how to read it next to volume as a liquidity check before you sell a put or a covered call.
PremiumGuard Research Deskoptions pricingwheel strategyincome
16 min read
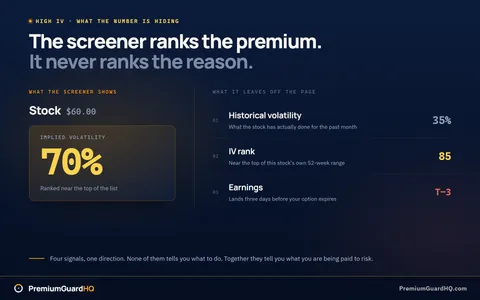
A $60 stock showing four signals at once: implied volatility at 70%, historical volatility at 35%, an IV rank of 85, and earnings landing three days before expiration, under the line that a screener ranks premium but never ranks the reason behind it.

What high IV options really mean before you sell a single put

What high implied volatility actually signals, how IV rank and IV percentile differ, and how to spot the catalyst before you sell the premium.
PremiumGuard Research Deskoptions pricingassignmentwheel strategy
23 min read
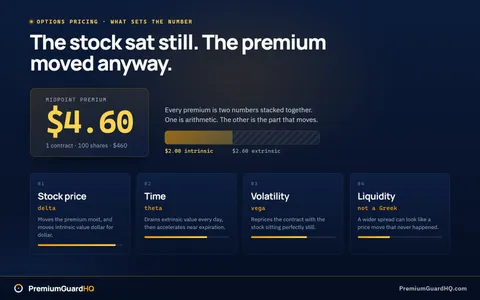
A midpoint premium of $4.60, or $460 for one contract, split into $2.00 of intrinsic and $2.60 of extrinsic value, with stock price, time, volatility and liquidity shown as the four forces that move it.

What is options pricing? The forces behind every premium

Options pricing explained: what a premium is made of, the five inputs that move it, and why a calculator's number can disagree with the market's.

PremiumGuard Research Deskoptions pricingincome