

Rows of numbers, packed tight, all seem equally important the first time you open an options chain.
They are not.
Most of that grid is noise. The numbers that matter tell you what you can actually buy or sell, and at what price. Misread the chain and two errors show up often. First is bid and ask. The bid is the highest price someone will pay you right now. The ask is the lowest price someone will accept to sell right now. Second is the contract multiplier. One options contract equals 100 shares, so a small price difference becomes a much larger dollar amount in a hurry. Misread either one and you will think you made money when you did not, or you will think a strike is easy to trade when it is nearly empty of buyers and sellers.
After this, you can point at any row on SPY’s chain and explain the bid, ask, volume, open interest, and delta in plain English.
What is an options chain?
An options chain is a table listing every call and put contract available for a stock or ETF. It groups contracts by expiration date and strike price, and each row shows that contract’s bid, ask, volume, and open interest. This guide uses the SPY options chain as its working example.
Look at it less like a single price for SPY options and more like a directory. Each row is its own small market, with its own buyers and sellers. There is no single SPY price like there is for a share of stock. There are hundreds of separate contract prices, each attached to a specific expiration date and strike price.
One detail catches nearly everyone at first. The displayed prices are per share. A single contract controls 100 shares. So if a call shows a price of $2.00, buying one contract costs $200, not $2. Keep that multiplier in mind on every row.
How an SPY options chain is organized
Before reading any row, check the clock. Option prices move fast. Look for a last updated time on the chain. Some free sources delay quotes by fifteen minutes or more, and a fifteen-minute-old SPY price can already be wrong. If the source does not say whether it is real-time or delayed, treat it as delayed.
Then pick the expiration date. This is the day the contract stops existing. Every row on the chain sits under a specific expiration. SPY is unusual here because it lists new expirations almost every trading day, including same-day contracts traders call 0DTE, short for zero days to expiration. That means the nearest expiration on SPY is often today, not next week.
After you pick an expiration, you get the standard layout. Calls sit on the left. A call gives the buyer the right to buy 100 shares at a set price. Puts sit on the right. A put gives the buyer the right to sell 100 shares at a set price. One column runs down the middle: the strike price, the set price written into the contract. Each row is two separate markets joined together, the call market on the left and the put market on the right at the same strike.
Finally, run a quick moneyness check. The strike closest to SPY’s current price is at-the-money, or ATM. For calls, strikes below the current price are in-the-money, or ITM. For puts, it reverses: strikes above the current price are ITM. Everything else is out-of-the-money, or OTM. One catch: ITM describes only where the strike sits relative to price. It says nothing about whether a trade actually made money after you count what was paid or collected.
How to read the columns that decide what price you can actually trade
Once you know where a row sits, the next question is what you can pay or collect there. That comes down to a few columns, not the flashy one in the middle.
Bid, ask, and last
The bid is the highest price a buyer is offering right now. The ask is the lowest price a seller is offering right now. If you are selling, the bid is your real price. If you are buying, the ask is your real price.
Then there is last. Last is the price of the most recent trade. It feels like the price, but it can be old news. That trade may have happened five minutes ago, before SPY moved. Here is the trap: a contract can show a nice last price of $1.50 while the bid sits at $1.10. Try to sell and you get $1.10, not $1.50. Last is history. Bid and ask are the live quotes.
Spread
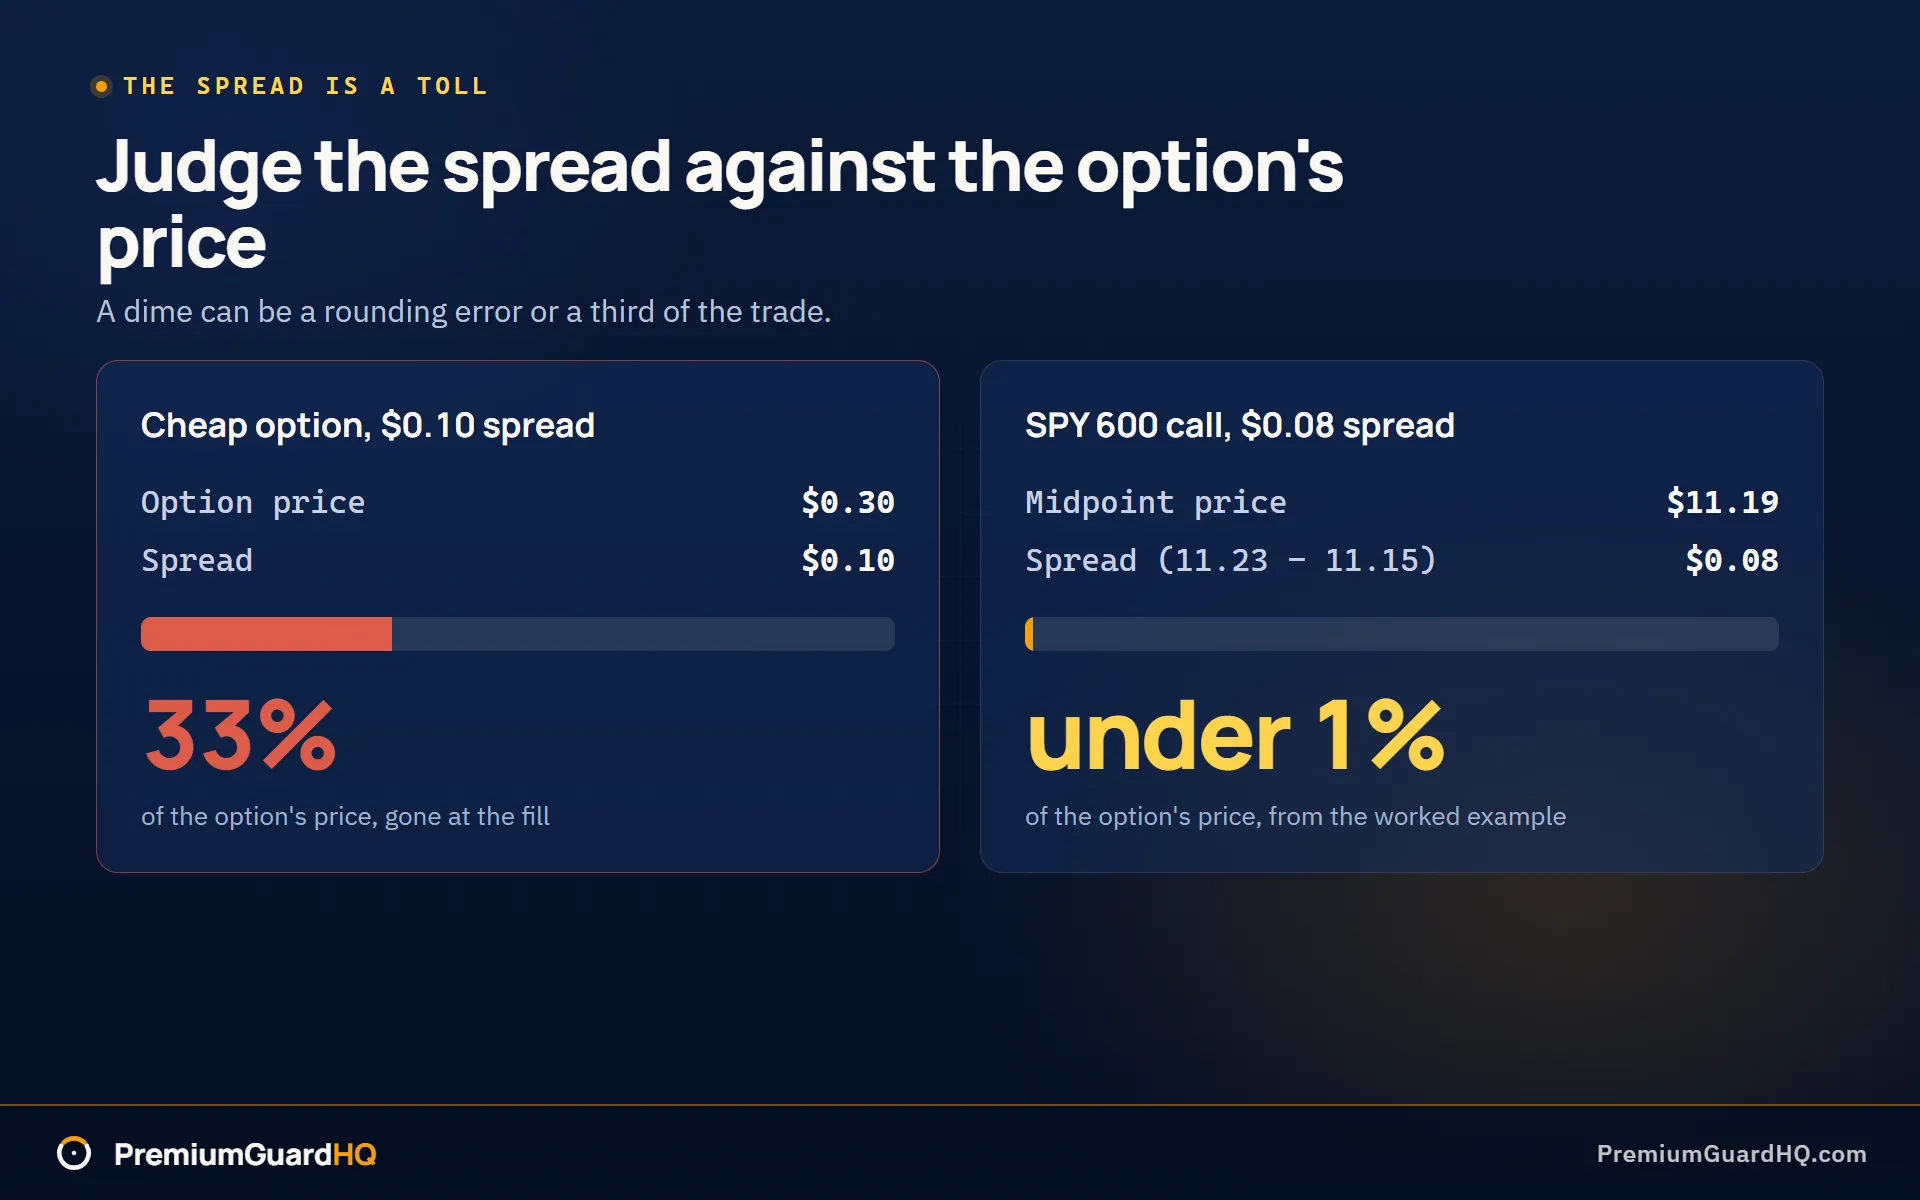
The spread is the ask minus the bid. It works like a toll for trading that contract. A $0.10 spread sounds small, but compare it with the price of the option itself. On a $0.30 option, $0.10 is a third of the whole value. That is a large chunk of money gone before the trade moves in your favor.
Volume vs open interest
Volume counts contracts traded today. It resets to zero every morning. Open interest counts contracts still open overnight, meaning someone is still holding them. High open interest with light volume can still trade fine on SPY. Low numbers on both usually mean rough fills. You place an order and either wait a long time or accept a bad price.
Implied volatility
Implied volatility, or IV, is the market’s guess at how much SPY will swing before the option expires. Higher IV usually means a fatter premium. Premium is just the option’s price. That is why a premium can shrink even when SPY moves the way you wanted. IV can drop, or time decay can eat the gain first. Time decay is the slow loss of an option’s value as expiration gets closer.
Reading the chain is step zero. What actually counts is what gets filled and logged. Tracking your real premium by closed cycle, meaning the full trade from open to close, is where premium turns into money you actually earned.
How to use delta and a chain calculator to turn one row into real numbers
The chain has one more column worth knowing: delta. Delta estimates how much an option’s price moves when SPY moves $1. A delta of 0.30 means the option’s price should move about $0.30 for every $1 move in SPY. Traders also use delta as a rough proxy for odds. That same 0.30 delta often gets read as roughly a 30% chance the contract ends in-the-money.
Neither reading promises anything. Delta shifts as SPY moves and as time passes. On SPY 0DTE options, delta can shift fast, and the contract’s price behavior changes by the hour as the clock runs out.
The same delta number answers two different questions depending on which side you are on. A seller often uses delta as a distance gauge: how close is this strike to the current price, and how likely is it to get tested. A buyer often uses it as a speed gauge: how much will this contract react if SPY moves. Same column, different question, and neither one guarantees an outcome. How quickly that reading changes is a separate column called gamma, and it matters most in the final week.
You can do breakeven math straight from the chain. For a call, breakeven at expiration equals the strike price plus the premium you paid. For a put, breakeven equals the strike price minus the premium you paid. Remember that the quoted premium is per share, so multiply by 100 to get the real dollar cost per contract.
An options chain calculator takes this further. You enter a strike, expiration date, premium, and sometimes an implied volatility guess. The tool shows the payoff at different SPY prices, either at expiration or before it. The workflow is straightforward.
- Copy the exact contract details straight off the chain: expiration, strike, call or put, and bid or ask.
- Pick an entry price assumption: the bid, the ask, or the midpoint between them.
- Check the payoff at a few different SPY prices to see how the numbers move.
None of this tells you what to trade. It only turns one row of the chain into numbers you can check yourself. Once a contract is open, the job changes. Now you track the premium collected, any assignments, meaning you ended up buying or selling the shares, and any roll credits cycle by cycle, so your real profit and loss holds up. That tracking matters even more across multiple brokers, since they often display cost basis differently from one another.
Worked example: reading one SPY chain row from left to right
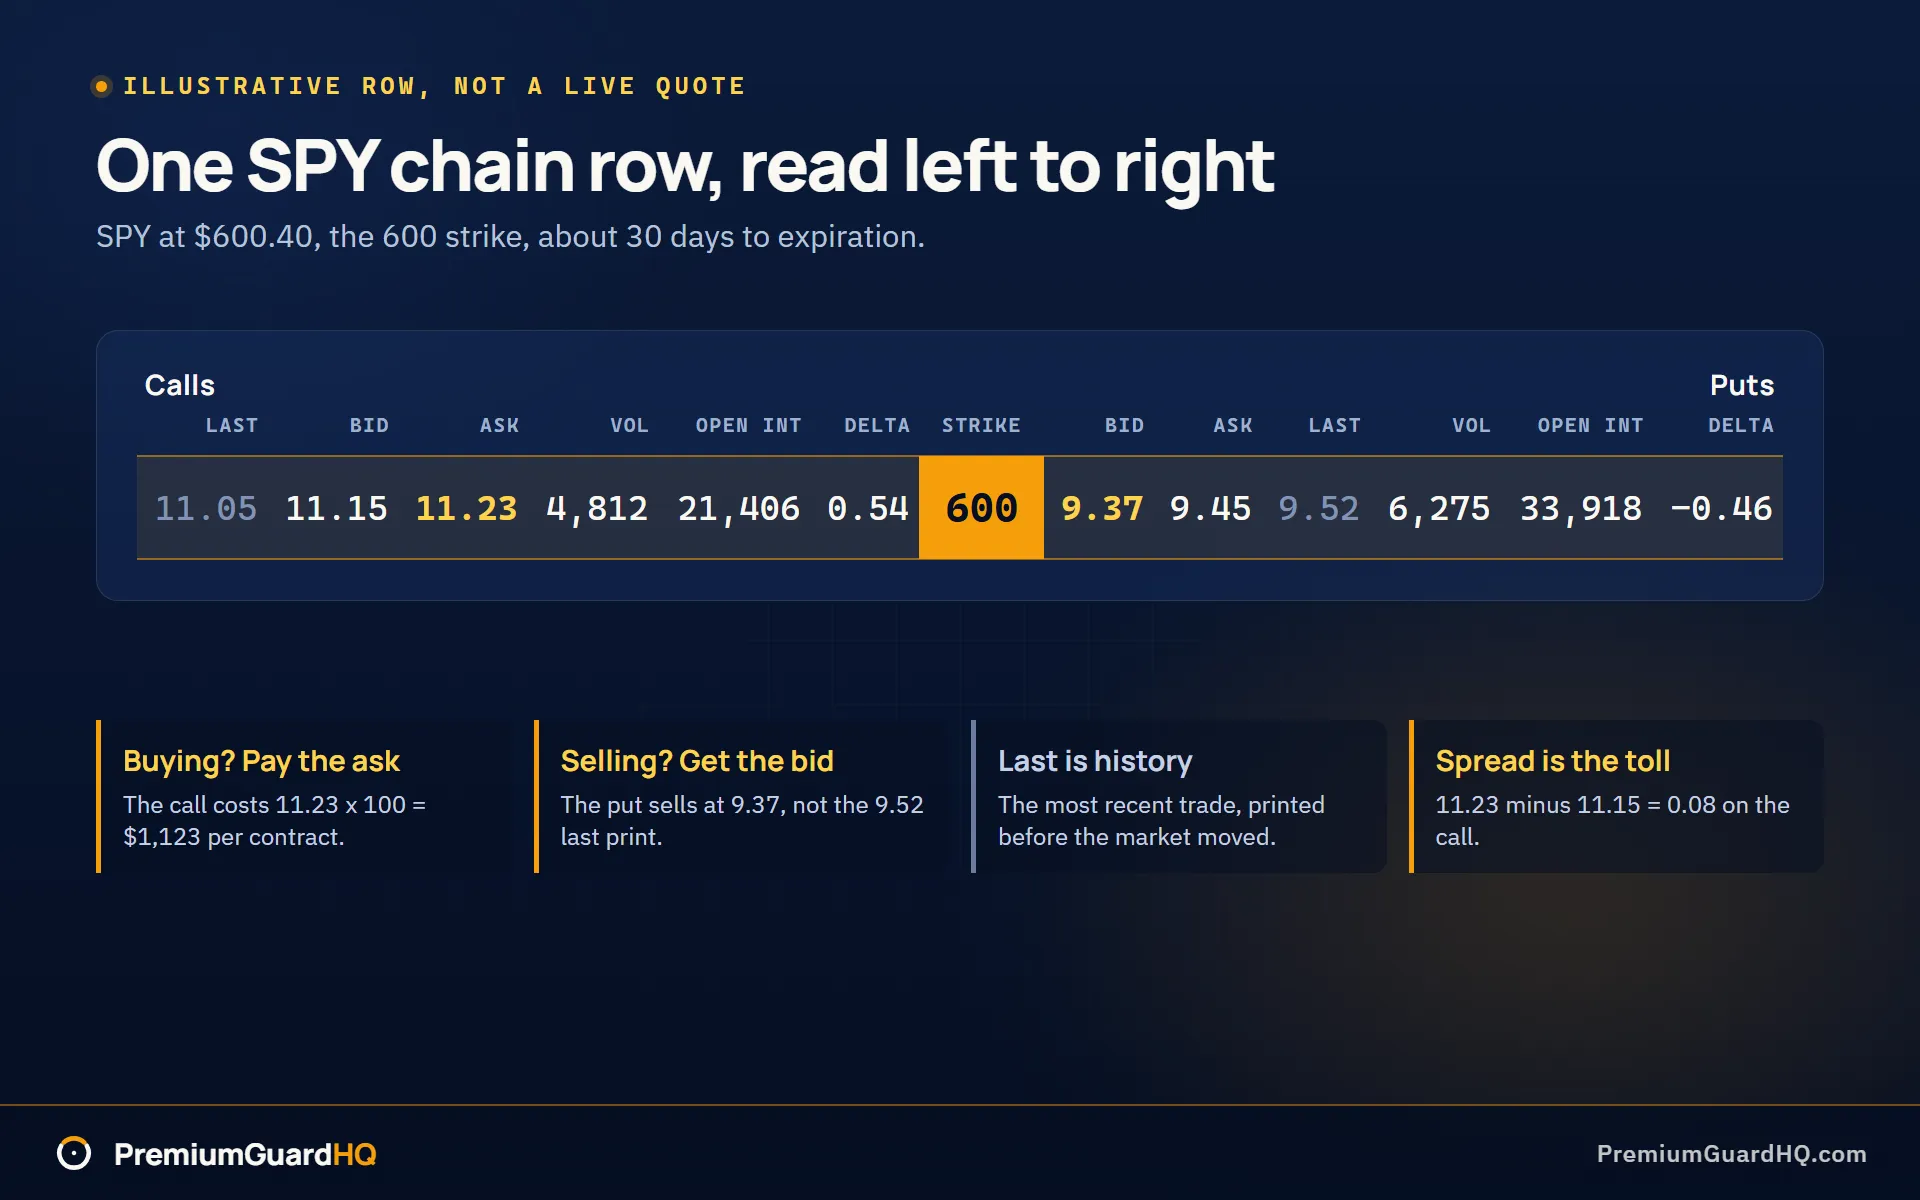
Work through one row. The numbers below are illustrative, not a live quote, but they are internally consistent the way a real chain is. Picture the option chain for SPY, an ETF that tracks the S&P 500 stock market index, with about 30 days left to expiration. SPY trades at $600.40. Use the 600 strike, the price at which you would buy or sell the shares. That strike sits almost exactly at the current price, so it is at-the-money.
Call
A call option gives the buyer the right to buy 100 shares at the strike price. The contract is the SPY 600 call. It shows a bid of 11.15 and an ask of 11.23. The bid is what buyers offer, and the ask is what sellers want. The last traded price is 11.05, below the current bid, because that trade printed before SPY ticked up. It is history, not a price you can trade at right now. To buy this call, you would pay the ask. That is $11.23 per share, times 100 shares in one contract, so $1,123 to open one contract.
Check liquidity next. Liquidity measures how easy it is to buy or sell without moving the price. Volume shows 4,812 contracts traded today, and open interest shows 21,406 contracts still open and unclosed. Both numbers are large, so this strike is easy to enter and exit. Delta reads 0.54. Delta measures how much an option’s price moves when the stock moves. This tells you the call’s price should move about $0.54 for every $1 move in SPY. It also fits the call being slightly in-the-money, meaning the strike is below the stock price.
Put
A put option gives the buyer the right to sell 100 shares at the strike price. The contract is the SPY 600 put. Bid is 9.37, ask is 9.45, and last is 9.52. Here the last trade sits above the ask, the mirror image of the call: a seller anchored on 9.52 would actually collect 9.37 at the bid. Volume comes in at 6,275, with open interest at 33,918. Both are heavier than the call side. Delta shows -0.46. The negative sign is normal for puts: it means the put’s price moves opposite to SPY. If SPY drops $1, this put gains roughly $0.46.
What one row proves
The bid and ask are the only prices you could actually trade. Last is not. Heavy volume and open interest on both sides confirm this strike sees real activity, not an empty market. Delta gives you a fast read on how each side behaves, but it is a snapshot, not a guarantee of what happens next.
Frequently asked questions
Is free SPY options chain data real-time?
Usually not. Most free options chain pages run on a delay, often fifteen minutes or more, and many carry a disclaimer that the data is for information only and not for trading decisions. If you are placing real orders, check the timestamp on the chain first. Real-time, execution-grade quotes typically come from your broker’s own platform or a paid data feed, not a free public page. Treat free chains as study tools unless the source clearly states the data is live.
Where can you get an option chain with delta for free?
Some free chain pages show delta right next to the bid, ask, and volume columns, though this varies by site and contract. If delta is missing on the page you are using, your broker’s chain almost always includes it. Options analytics sites that compute the Greeks, meaning delta, theta, and the other risk numbers, are another free option. Check a couple of sources if one is missing the column you need.
How do you use an options chain calculator with chain data?
Pull the row’s details straight from the chain: the underlying stock, expiration date, strike price, whether it is a call or put, and an entry price. Use the bid, ask, or the midpoint between them as that entry price. The calculator then shows payoff at expiration, breakeven, and, if it includes Greeks, how sensitive the price is to moves in the stock. The goal is to turn one row of numbers into a small set of figures you can log and check later. Those figures are the inputs for working out the profit and loss on the position once it is open.
Why do single-stock option chains often look worse than SPY’s?
Because most single stocks are less liquid. SPY is one of the most heavily traded options markets in the world, so its spreads stay tight and volume stays high. Many single-name stocks do not get that same traffic. When volume and open interest are low, the bid and ask can sit far apart, and the last traded price becomes nearly meaningless. On those names, check the spread, volume, and open interest more carefully than you would on SPY. Those columns tell you more about what is actually tradable than the strike price does.