
Your short put can sit still for three weeks. It barely changes, and it hardly seems worth checking. A short put commits you to buy 100 shares at a set price. You sold that commitment for cash up front, and that cash is the premium.
Then week four arrives. The stock drops 2%, and the position suddenly bleeds like a different trade. The stock moved the same amount it might have moved last month. The result is nothing like it.
The reason has a name: gamma in options. Gamma measures how quickly your position’s price sensitivity shifts when the stock moves. It turns sharp in the last week before expiration, and that abrupt turn catches wheel sellers off guard.
The rest of the article covers what gamma measures, when it spikes hardest, and how to read it in that last week, so your roll decisions come from arithmetic instead of panic.
What is gamma in options
Gamma tracks how much an option’s delta changes when the stock moves $1. Delta shows how much the option’s price moves for that same dollar. Gamma runs highest near the current stock price, especially as expiration approaches.
One way to picture it: delta is your speed, and gamma is how hard you are pressing the gas pedal. Delta answers “how much.” Gamma answers “how fast that how-much changes.”
Gamma never stays fixed. It reshapes itself as the stock moves, as expiration gets closer, and as the market’s fear gauge shifts. Expiration is just the date the contract ends. That is why a position that felt calm three weeks ago can turn jumpy overnight, with price swings widening on small stock moves.
How gamma works in practice: delta does not stand still
Every time the stock ticks, a loop runs. The stock moves first. Delta updates second. Your option’s price sensitivity changes third because delta changed.
Walk it with small numbers. A call has a delta of 0.40, so for each $1 the stock moves, the option price moves about $0.40. Say gamma is 0.08. Gamma tells you how much delta itself shifts for that same $1 move.
The stock rises $1. Delta was 0.40. Add gamma and the new delta is roughly 0.48. The stock rises another $1. Delta was 0.48. Add gamma again, because gamma stayed roughly the same, and delta becomes about 0.56.
The second $1 move lifted delta by the same 0.08, but that 0.08 now sits on a larger base. With high gamma, each later dollar move tends to matter more than the prior one. The move that hurts most is often not the first. It is the next one.
One more piece. Options you bought carry positive gamma. Options you sold carry the opposite exposure, negative gamma. When you are short an option, meaning you sold it, delta tends to shift against you as the stock moves, not in your favor.
That matters for the wheel. Selling puts and covered calls both leave you short options, so you are short gamma on both sides of the cycle. That is the mechanical reason risk speeds up near expiration instead of slowing down.
One note on tools. Your broker’s platform does not measure gamma directly. It calculates gamma from a pricing model and current implied volatility, which is the market’s guess at how much the stock will swing. Treat gamma as an estimate that updates with conditions, not a fixed fact carved in stone.
Gamma is delta’s accelerator: what it measures and how it is calculated
Gamma answers one question: if the stock moves $1, how much does delta change? You can put a number on it like this.
The simplest method uses arithmetic straight from your option chain. Gamma ≈ (new delta - old delta) ÷ (new stock price - old stock price). Check the option’s delta now, wait for the stock to move a dollar, check delta again, then subtract. The difference divided by the dollar move is your gamma.
That is an estimate, not an exact reading. Gamma itself changes as the stock moves, so you are measuring a moving target. It is like checking speed by timing yourself over one mile. Close enough to be useful, but not a speedometer.
A model also sits behind the number your broker displays. The common formula is Γ = N’(d1) ÷ (S × σ × √T). Solving it by hand is unnecessary. The useful part is knowing what each component does to the result.
Look at the bottom of that formula. T is time left until expiration, under a square root sign. As T shrinks toward zero, dividing by a smaller square root makes the whole result larger. That is the mechanical reason gamma climbs hard in the final days before expiration.
S is the stock price. σ, called sigma, is implied volatility, the market’s guess at how much the stock will swing. Both sit on that bottom row. That is why a $500 stock and a $20 stock, or a calm stock and a wild one, do not build gamma at the same rate per dollar of movement.
The top piece, N’(d1), peaks when the stock price sits right at the strike. That is the mathematical reason gamma concentrates around at-the-money, the zone your short puts and calls tend to drift into late in a cycle.
One distinction to lock in. Delta is the first sensitivity: how much your position’s value moves per $1 of stock movement. Gamma is the second sensitivity: how fast delta itself moves. Vega measures a different risk entirely, shifts in implied volatility, and is not a stand-in for gamma.
For the wheel, this is the point. Gamma is why a “small move” and a “small risk” quietly stop meaning the same thing as expiration nears.
Where gamma gets dangerous: at the money plus the final week
Two forces push gamma higher. You already met one in the formula above. They show up together like this in a real trade.
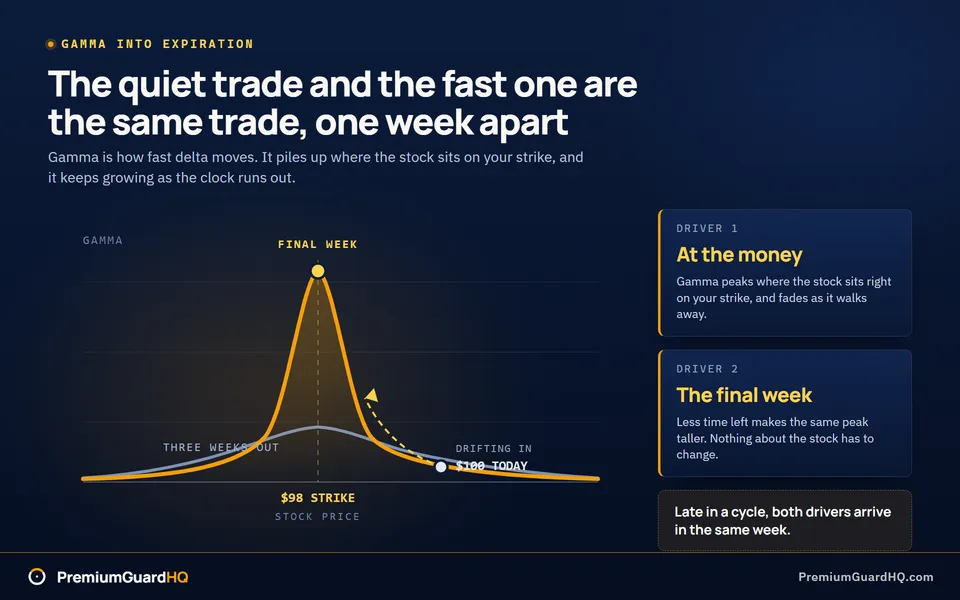
The first is moneyness: how close the stock price sits to your strike, the price written into the option contract. Gamma peaks when the stock sits right at the strike, which is called at the money. Gamma shrinks as the stock drifts farther above or below that strike.
The second is time. Gamma usually climbs as expiration approaches, especially for options near the strike. With plenty of time left, gamma stays gentle even at the money. As expiration nears, it turns sharp.
That sets a trap for a wheel trade. Early in the cycle, your short strike usually sits comfortably below the stock price. That position is out of the money. Gamma is small there, so the trade barely reacts to normal daily noise.
Then time passes and the stock drifts down toward your strike, as stocks often do. Nothing dramatic happens. But you have now walked into the zone where gamma is strongest, during the same week it is already climbing just from time running out. Both drivers stack.
The result is that delta can jump fast on a small stock move. Assignment odds, the chance you get forced to buy or sell the shares, can swing harder than a month ago on the same size move. Open profit or loss can swing just as hard.
Watch for this warning sign. Being pinned near the strike late in the cycle is a different risk than sitting far from it, no matter what your original plan assumed. A 1% stock move in the final week can change your real exposure more than the same 1% move did in week one.
One quick contrast because it trips people up. Vega measures how sensitive your option is to changes in implied volatility, the market’s guess at how much the stock will swing. Vega usually shrinks as expiration nears. Gamma does the opposite. Late-cycle danger is rarely a volatility story. It is a gamma story driven by price location and the little time left.
That is the idea underneath everything here. Premium feels like income when it lands in your account. It only becomes real income once the wheel cycle closes.
What short gamma feels like in a wheel portfolio: position gamma and chain reading
Gamma on the chain is just one contract’s worth. Your account holds many contracts, each covering 100 shares. Converting that single-contract number into your actual exposure makes gamma useful rather than merely interesting.
Start with contract gamma. That is the gamma number your option chain shows for one contract. It tells you how much delta changes for that one contract if the stock moves $1. Delta itself is the option’s price change per $1 move in the stock.
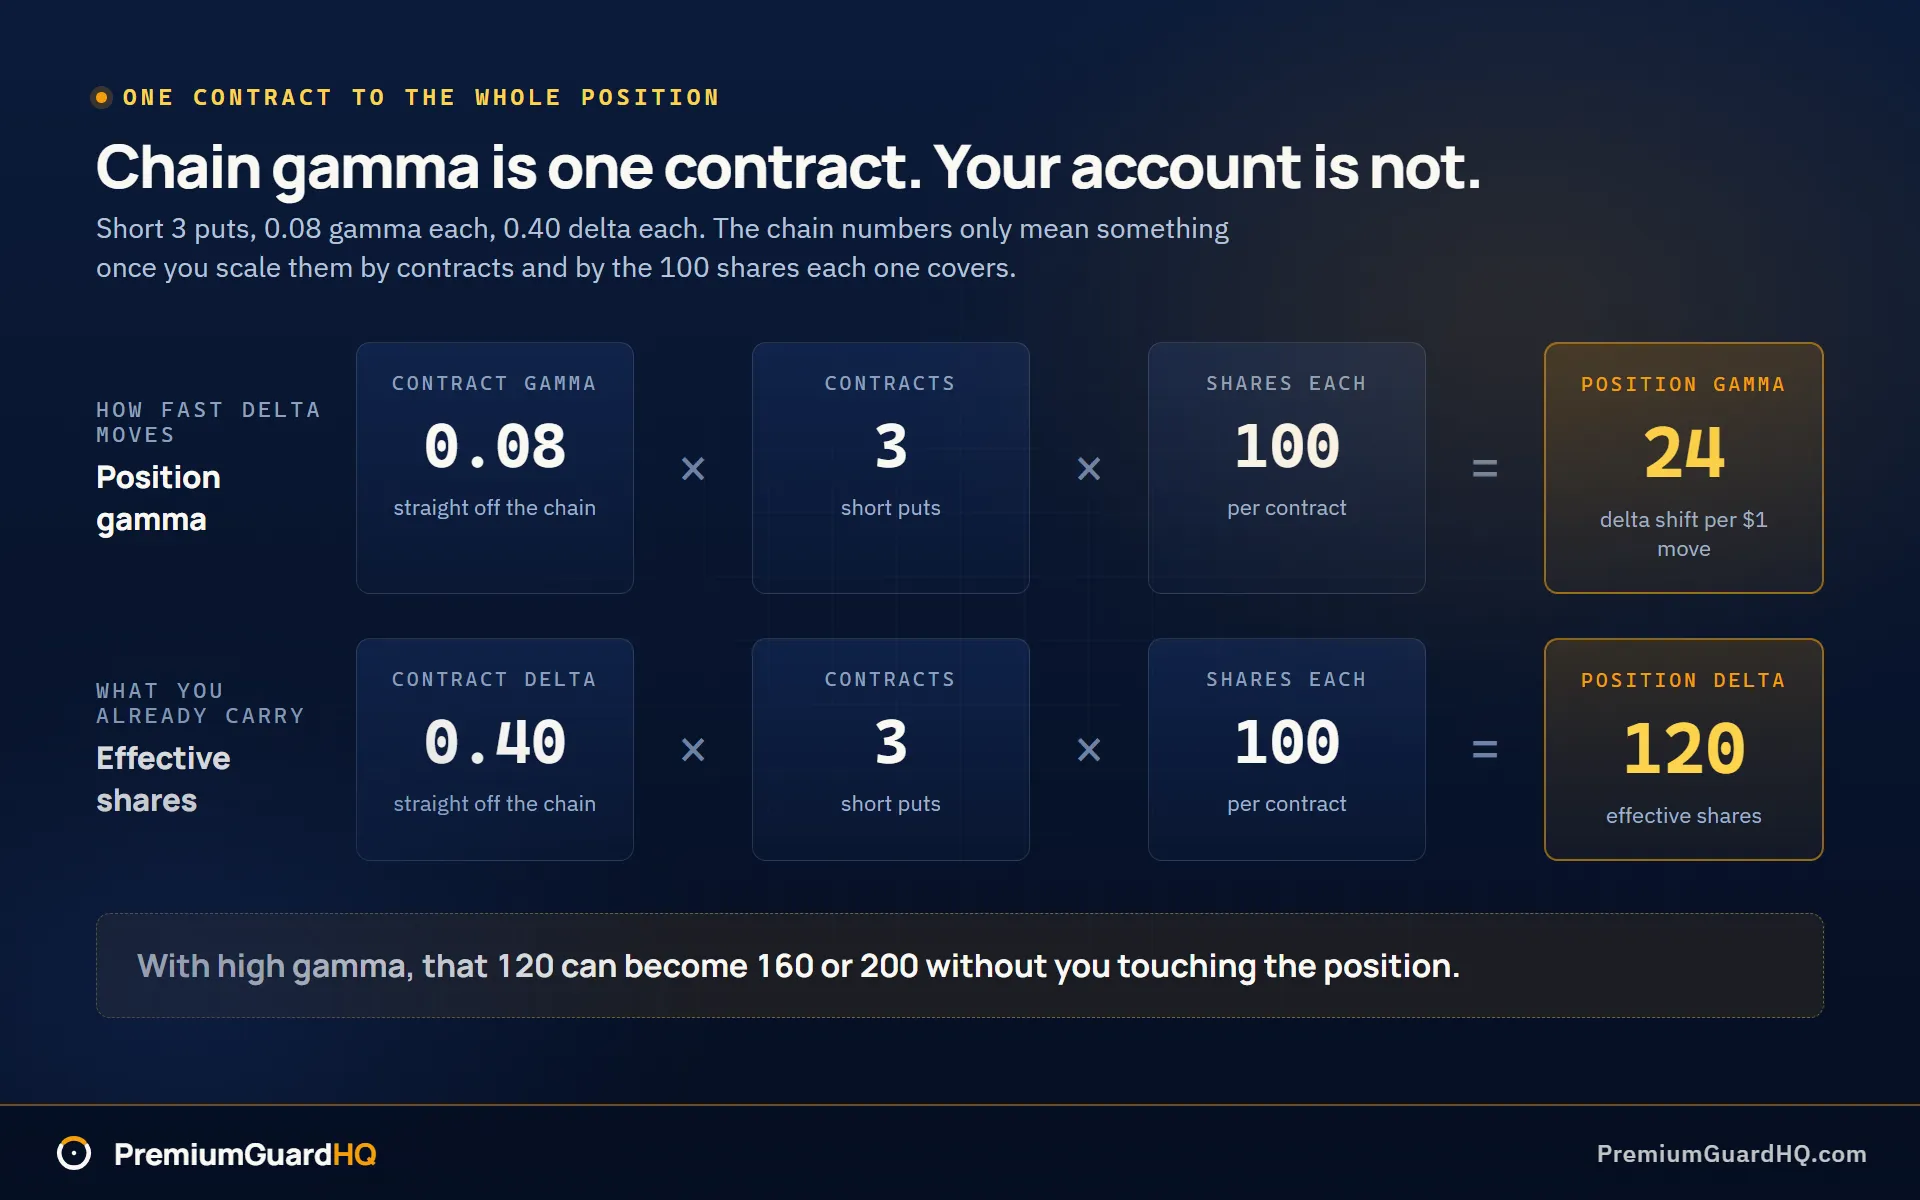
Now scale it up. Position gamma equals contract gamma times the number of contracts times 100, because each contract covers 100 shares. If you are short 3 puts with 0.08 gamma each, your position gamma is roughly 24. That number tells you how fast the whole position’s delta is shifting, not just one contract’s.
Delta scales the same way. Position delta is roughly delta times contracts times 100. Think of that number as effective shares, the stock exposure you are carrying right now even though you do not own shares yet. A delta of 0.40 on 3 contracts means you are acting like you own about 120 shares. With high gamma, that 120 can become 160 or 200 fast without you touching the position.
A simple chain-reading habit follows. On the same chain you use to pick a strike, find the strikes closest to the current stock price. Gamma bunches up there, as covered earlier. Compare your own short strike’s gamma today against its level when you opened the trade. Watch for the combination that matters most: high gamma sitting right where the stock price is. That combination means your assignment odds, the odds you get forced to buy or sell shares, can move fast on a small tick.
For the wheel specifically, a down move on a short put can do more than hurt a little. It makes you synthetically longer shares, and faster as the stock approaches your strike. On a covered call, an up move is the mirror: it makes you synthetically shorter the upside, faster as the stock nears the call strike.
One related idea comes with a caveat: treat it as an estimate, not a fact. Some traders watch dashboards for gamma exposure, often shortened to GEX. These try to estimate where gamma is piled up across the whole market, not just in your position, and sometimes label spots as “walls” or “flip levels.” Treat this as market plumbing, not a promise. GEX numbers are vendor-specific and modeled, not measured, so use them as context, never as a guaranteed magnet pulling price toward a level.
That drift is what PremiumGuard’s approach is built around: every open cycle in one view, with the strike, the running premium and the adjusted cost basis sitting together, so a position that has quietly walked toward its strike is visible before the final week decides it for you.
Worked example: the short put that looked fine until gamma showed up
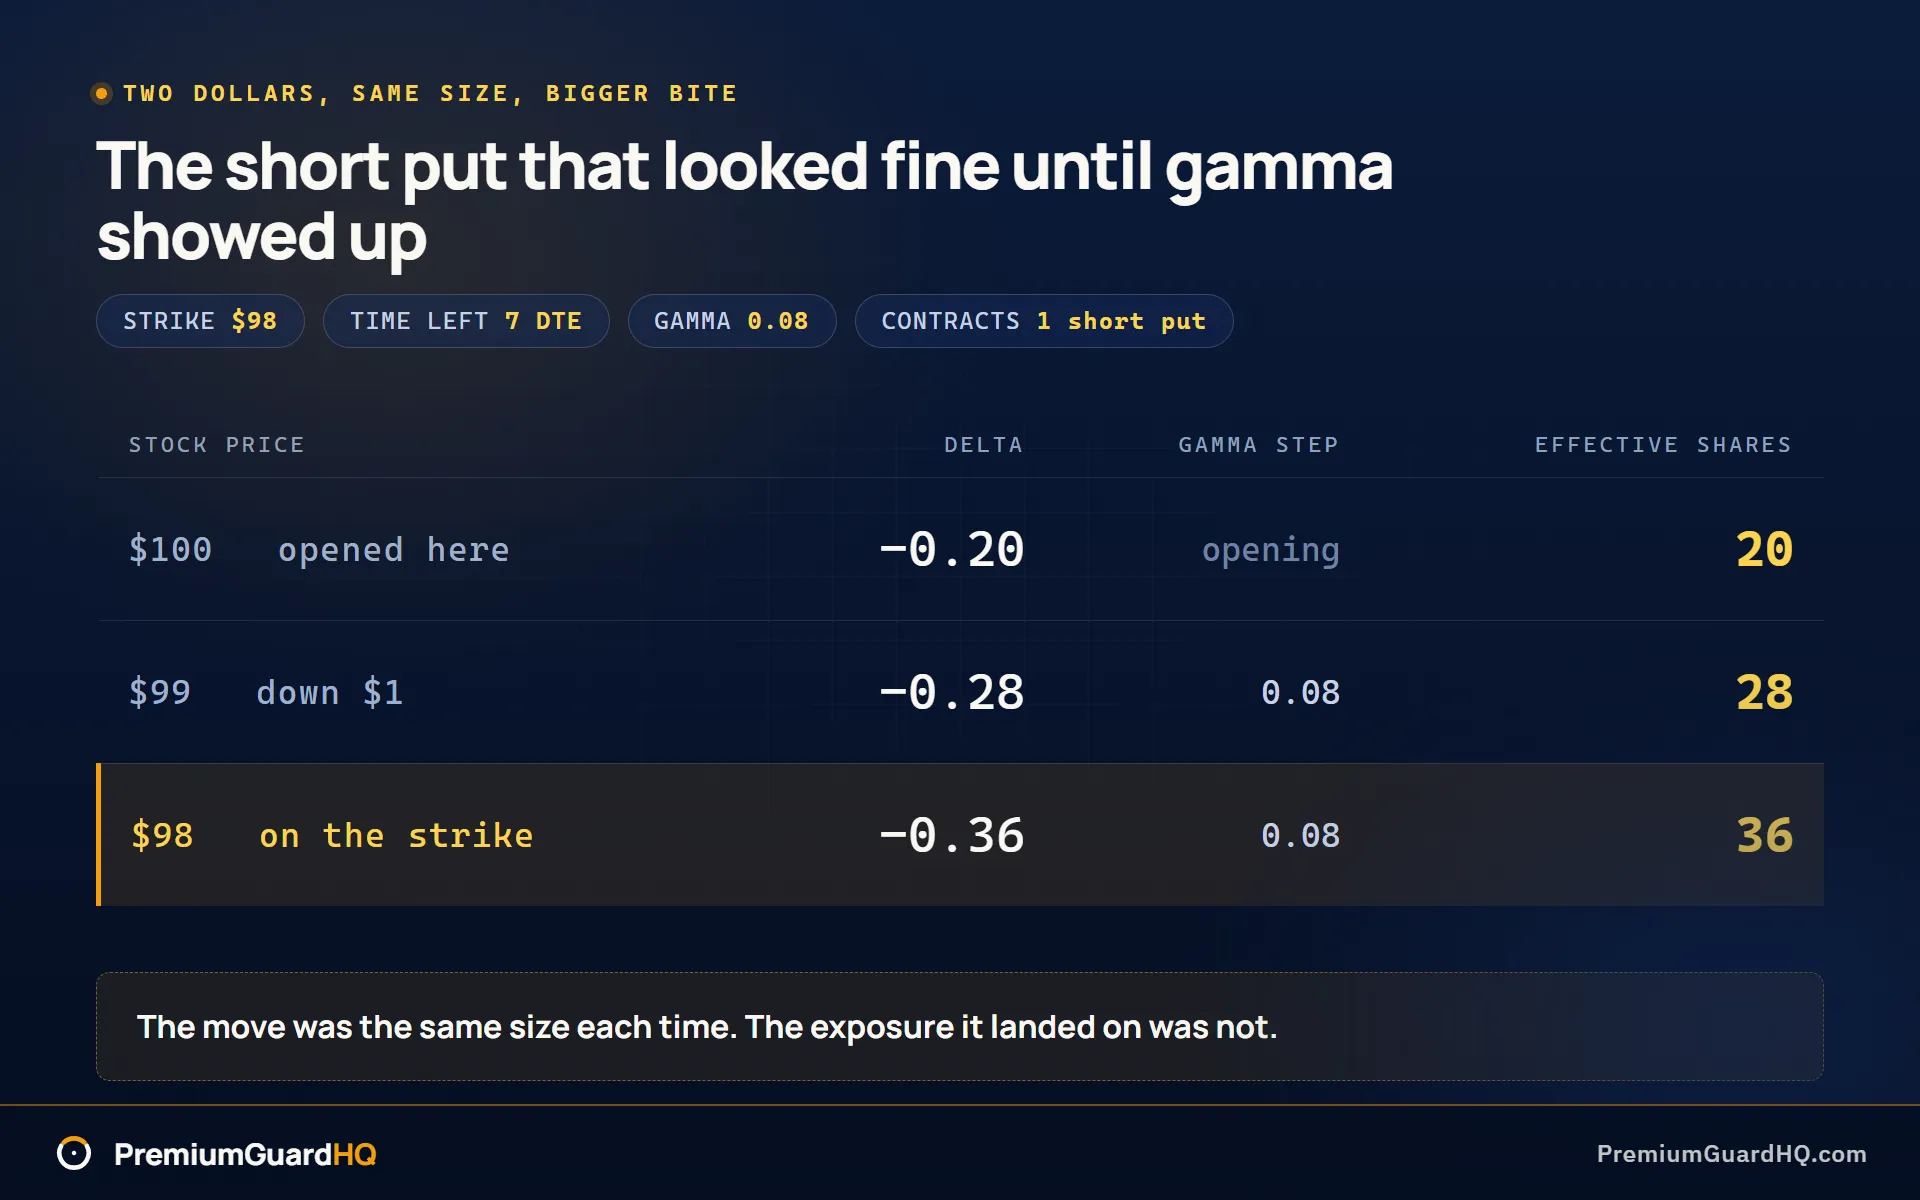
This plays out with real numbers. A stock sits at $100. You sold one cash-secured put at a $98 strike price, which means you promised to buy 100 shares at $98 if the stock falls that far. There are 7 days left until expiration, often called 7 DTE. If you want the collateral and the breakeven behind a trade like this one, price a short put against your own cash before you read the Greeks on it.
Your put has a delta of -0.20. Delta tells you how much the option’s value moves when the stock moves $1. Your gamma is 0.08. Gamma tells you how fast delta itself changes as the stock moves. Multiply delta by 100 shares and the position behaves like you are long about 20 shares of stock, because selling a put leaves you leaning long. Small, quiet, easy to ignore.
The stock drops $1 to $99. Add gamma to delta: -0.20 becomes roughly -0.28. Your position now behaves like 28 shares. The stock drops another $1 to $98, right at your strike. Delta moves again to roughly -0.36, or 36 shares of exposure.
Look at what just happened. The first $1 drop added 8 shares of exposure. The second $1 drop added another 8, on top of a position that was already carrying more. The move was the same size each time. The bite got bigger each time.
If the stock keeps hovering near $98 into the last week before expiration, gamma often stays high. Small price wiggles can swing delta fast, shrinking the window for deciding whether to roll the put or accept assignment of the shares.
One thing is worth carrying forward. Gamma never tells you which way the stock will move. It only tells you how fast your exposure changes if the stock does move. That is the difference between a position that feels calm and one that feels like it flipped overnight.
Gamma is useful, but it is not a cheat code
Gamma helps you see risk clearly, but it does not hand you a crystal ball. A few honest limits keep it from becoming a false promise.
Gamma is a snapshot, not a forecast. The number you see applies right now. One stock move can change delta, the number that shows how much your option’s value shifts when the stock moves a dollar. That same move often changes gamma too. Yesterday’s gamma reading will not tell you today’s exposure.
Your broker’s number comes from a model, not a fact. Gamma is calculated from a pricing model. That model runs on implied volatility, the market’s guess at how much the stock will swing in the future. Different brokers can show slightly different gamma numbers for the same contract because their models or volatility inputs differ slightly.
Near expiration, the market itself gets messy. Wide bid-ask spreads, thin trading, and fast price jumps can matter more than the clean gamma math on your screen. The gap between the price you want and the price you get widens when few people trade a contract. In that environment, gamma tells you less than it seems to.
Gamma is not your whole risk picture. Being assigned shares, dividends on covered calls, overnight price gaps, and several positions moving together can hurt you more than gamma on any single contract. Assignment means you are forced to buy or sell the stock because someone exercised their option. A single gamma number never captures those risks.
Other Greeks do not stop existing just because you are watching gamma. Late in a cycle, gamma often climbs while vega shrinks and theta speeds up. Vega measures how much an option’s price moves when volatility changes. Theta measures how much value an option loses each day from time passing. If you watch gamma alone, you can misread what actually moved your account.
Frequently asked questions about gamma
How is gamma calculated in options?
Two ways can produce this number. The quick trader version is gamma equals the change in delta divided by the change in the stock price. Check delta now, wait for the stock to move a dollar, check delta again, and subtract. Most trading platforms skip that manual work and calculate gamma from a pricing model fed by the current stock price, time left until expiration, and implied volatility, the market’s guess at how much the stock will swing. Both approaches land in the same neighborhood. The platform version just updates faster and automatically.
How is delta calculated, and why does gamma change it?
Delta estimates how much an option’s price moves when the stock moves $1. Gamma estimates how much delta itself moves on that same $1 move. Think of delta as speed and gamma as how hard the gas pedal is pressed. Delta is a moving estimate rather than a fixed probability you can lock in and forget, and gamma is the exact reason it can jump around near the strike late in the cycle. See the sections above for the full breakdown.
What is vega in options, and why is it not a substitute for gamma?
Vega measures how much an option’s price moves when implied volatility changes. It has nothing to do with the stock actually moving. Near expiration, vega usually shrinks while gamma often climbs. A headline saying “volatility is down” does not mean your risk is down. If your short put is sitting near the strike in the final week, gamma is running the show, not vega.
What does an option Greeks calculator actually do?
It takes inputs such as the option’s price, time left until expiration, and the current stock price, then outputs estimated Greeks including delta, gamma, vega, and theta. Theta measures how much value an option loses each day from time passing. These calculators are useful for comparing scenarios side by side before you act. They are not a promise of what will happen, especially in the final week when prices, volatility, and gamma can all shift faster than a snapshot can capture.