
Most bad options trades don’t start with a bad idea. They start with a bad fill. That’s the price you actually get when you buy or sell a contract. You place a trade, and the gap between the buy price and the sell price is so wide it eats your profit before you even begin. Or worse, your expiration date is close and you can’t close the position early without giving away money just to get out.
This almost always traces back to one thing: liquidity. Liquidity just means how easy it is to buy or sell something fast, at a fair price.
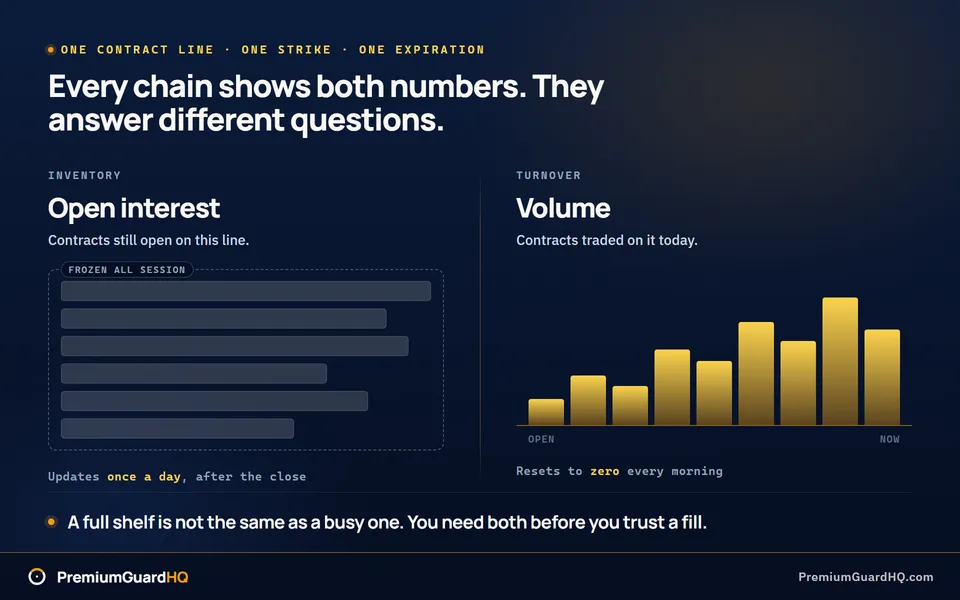
Here’s where most traders get stuck. Every options chain shows two numbers that look similar but measure very different things: open interest options and volume. Open interest is the total number of option contracts still open right now. Volume is how many contracts traded today. Volume alone can trick you into thinking a contract is easy to trade when it really isn’t.
By the end of this, you’ll know what open interest measures, when it updates, and how to use it with volume as a quick liquidity check. That check matters most right before you sell a put or a covered call. A covered call is a promise to sell stock you already own at a set price by a set date.
One clean definition to start with: open interest is the total number of option contracts that are still open. That means they haven’t been closed, exercised, or expired yet.
What is open interest in options
Open interest in options is the total number of contracts still open for one specific strike price and expiration date. It goes up when a new buyer and seller create a contract. It goes down when contracts are closed, exercised, or expire. Brokers update this count once per day, not live during trading.
That last point trips people up the most. Open interest updates once, after the market closes, then gets posted the next morning, so it does not change with every trade during the day. Volume, by contrast, is the count of contracts traded that day, and it resets to zero every morning. The two numbers answer different questions, so mixing them up leads to bad reads.
Open interest also covers a much narrower slice than people assume. It applies to one single contract line: one strike price, one expiration date, and either a call or a put, a contract with a buyer’s right and a seller’s obligation on opposite sides. It is not one number for the stock’s whole options market. A stock can have thousands of contracts open at one strike and almost none at another strike just a dollar away.
Think of open interest as a rough headcount. It tells you how many contracts are still on the books for that exact strike and date. A higher headcount usually means more people are willing to trade that contract at a fair price, with a small gap between the buy and sell price. A low headcount is often a warning sign, and spotting that is what the rest of this guide will help you do.
How open interest actually changes and when the number updates
Open interest counts one thing: contracts that are still open. A contract stays in that count until it closes, gets exercised, or expires. Exercise means the option owner uses their right to buy or sell the stock. Until one of those events happens, the contract stays part of the count.
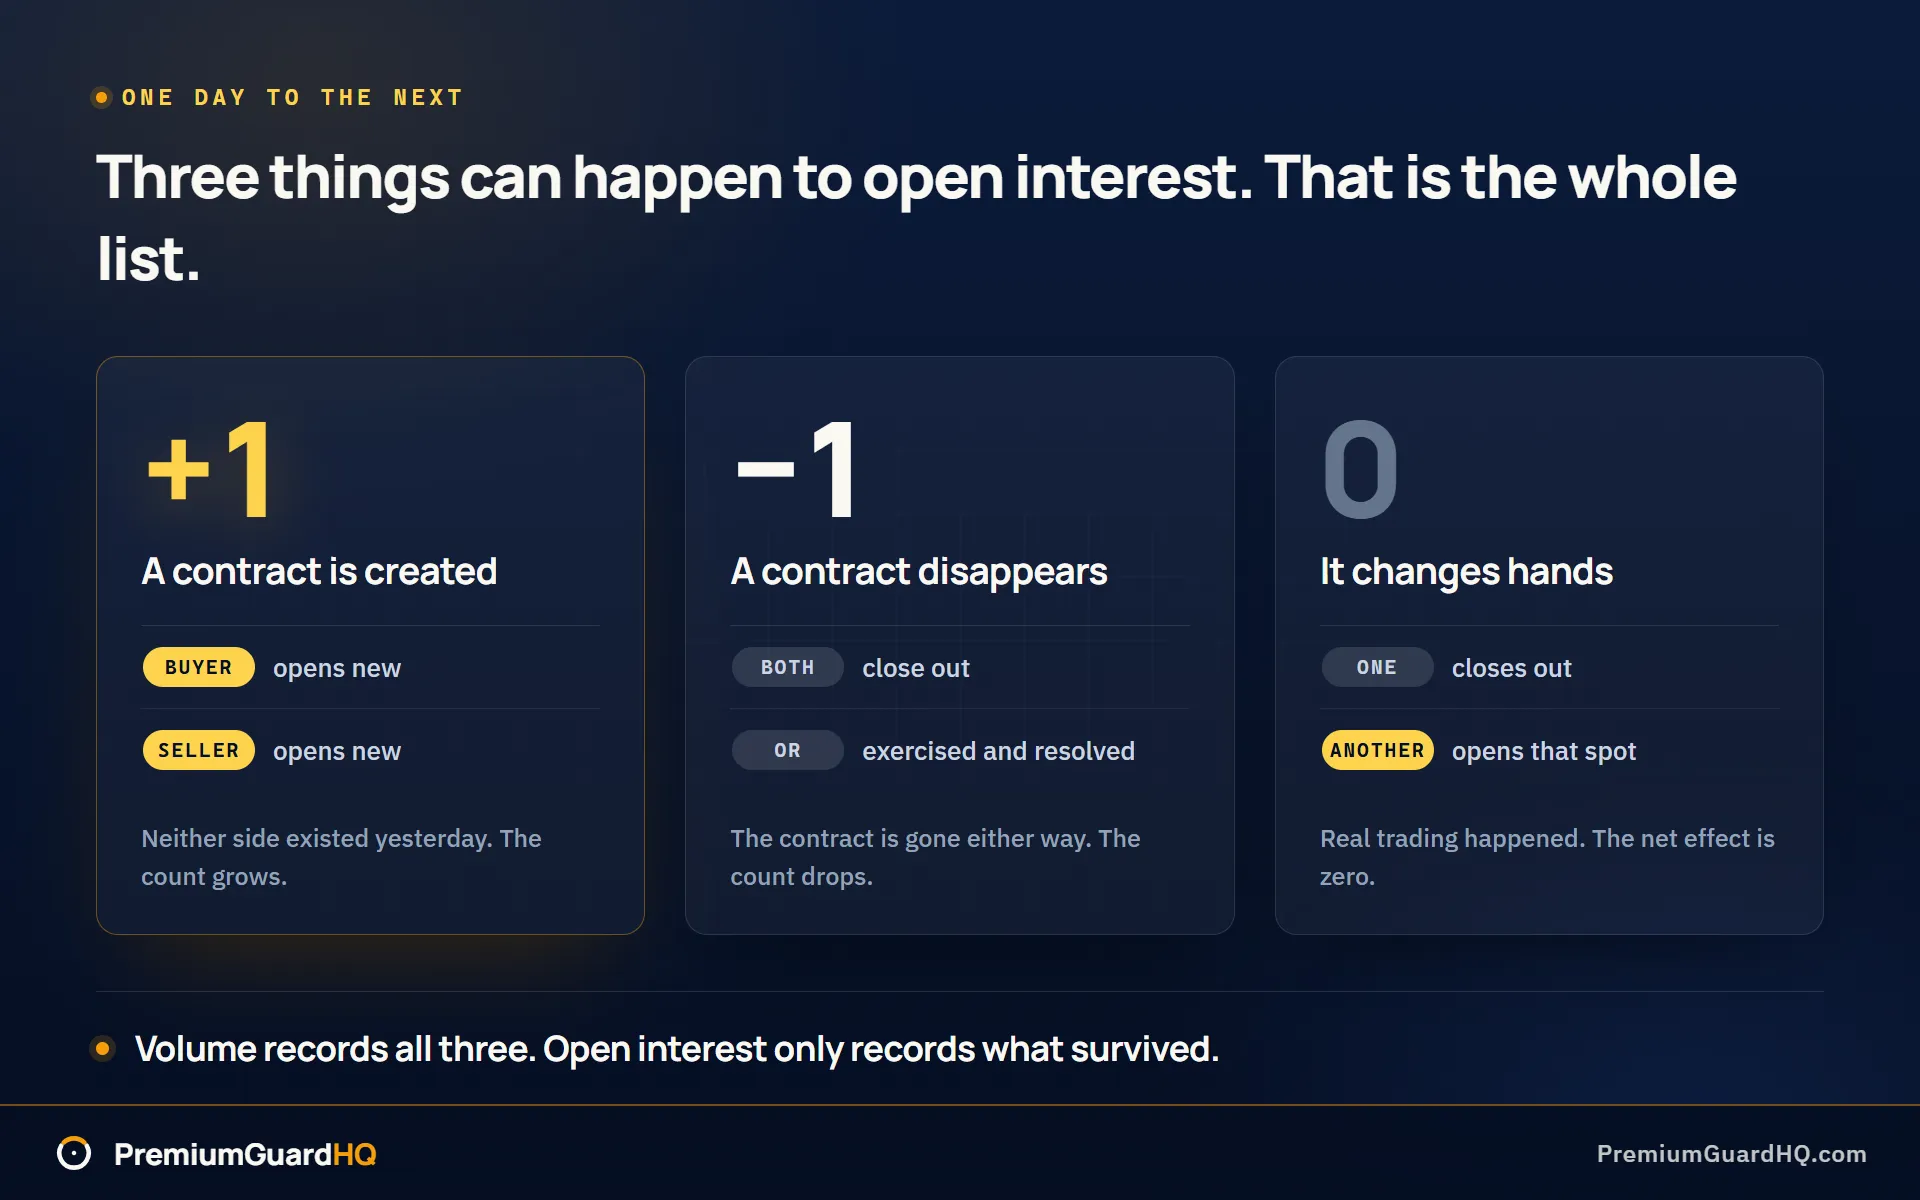
Only three things can happen to open interest from one day to the next. It goes up, goes down, or stays flat. Here is what causes each one.
Open interest goes up by 1 when a brand new contract gets created. One trader opens a new position and another trader takes the other side, also opening new. Buyer opens, seller opens, and a contract that didn’t exist yesterday now exists.
Open interest goes down by 1 when a contract disappears completely. This happens when both sides close out, or when the contract gets exercised and resolved. Assignment is what happens to the other trader when the option owner exercises against them. Either way, the contract is gone, so the count drops.
Open interest stays the same when a contract just changes hands. One trader closes their position while a different trader opens a new one to take that exact spot. Real trading happened, but the net effect is zero.
That is the whole list. Anyone selling you a more complicated theory of open interest is overcomplicating it.
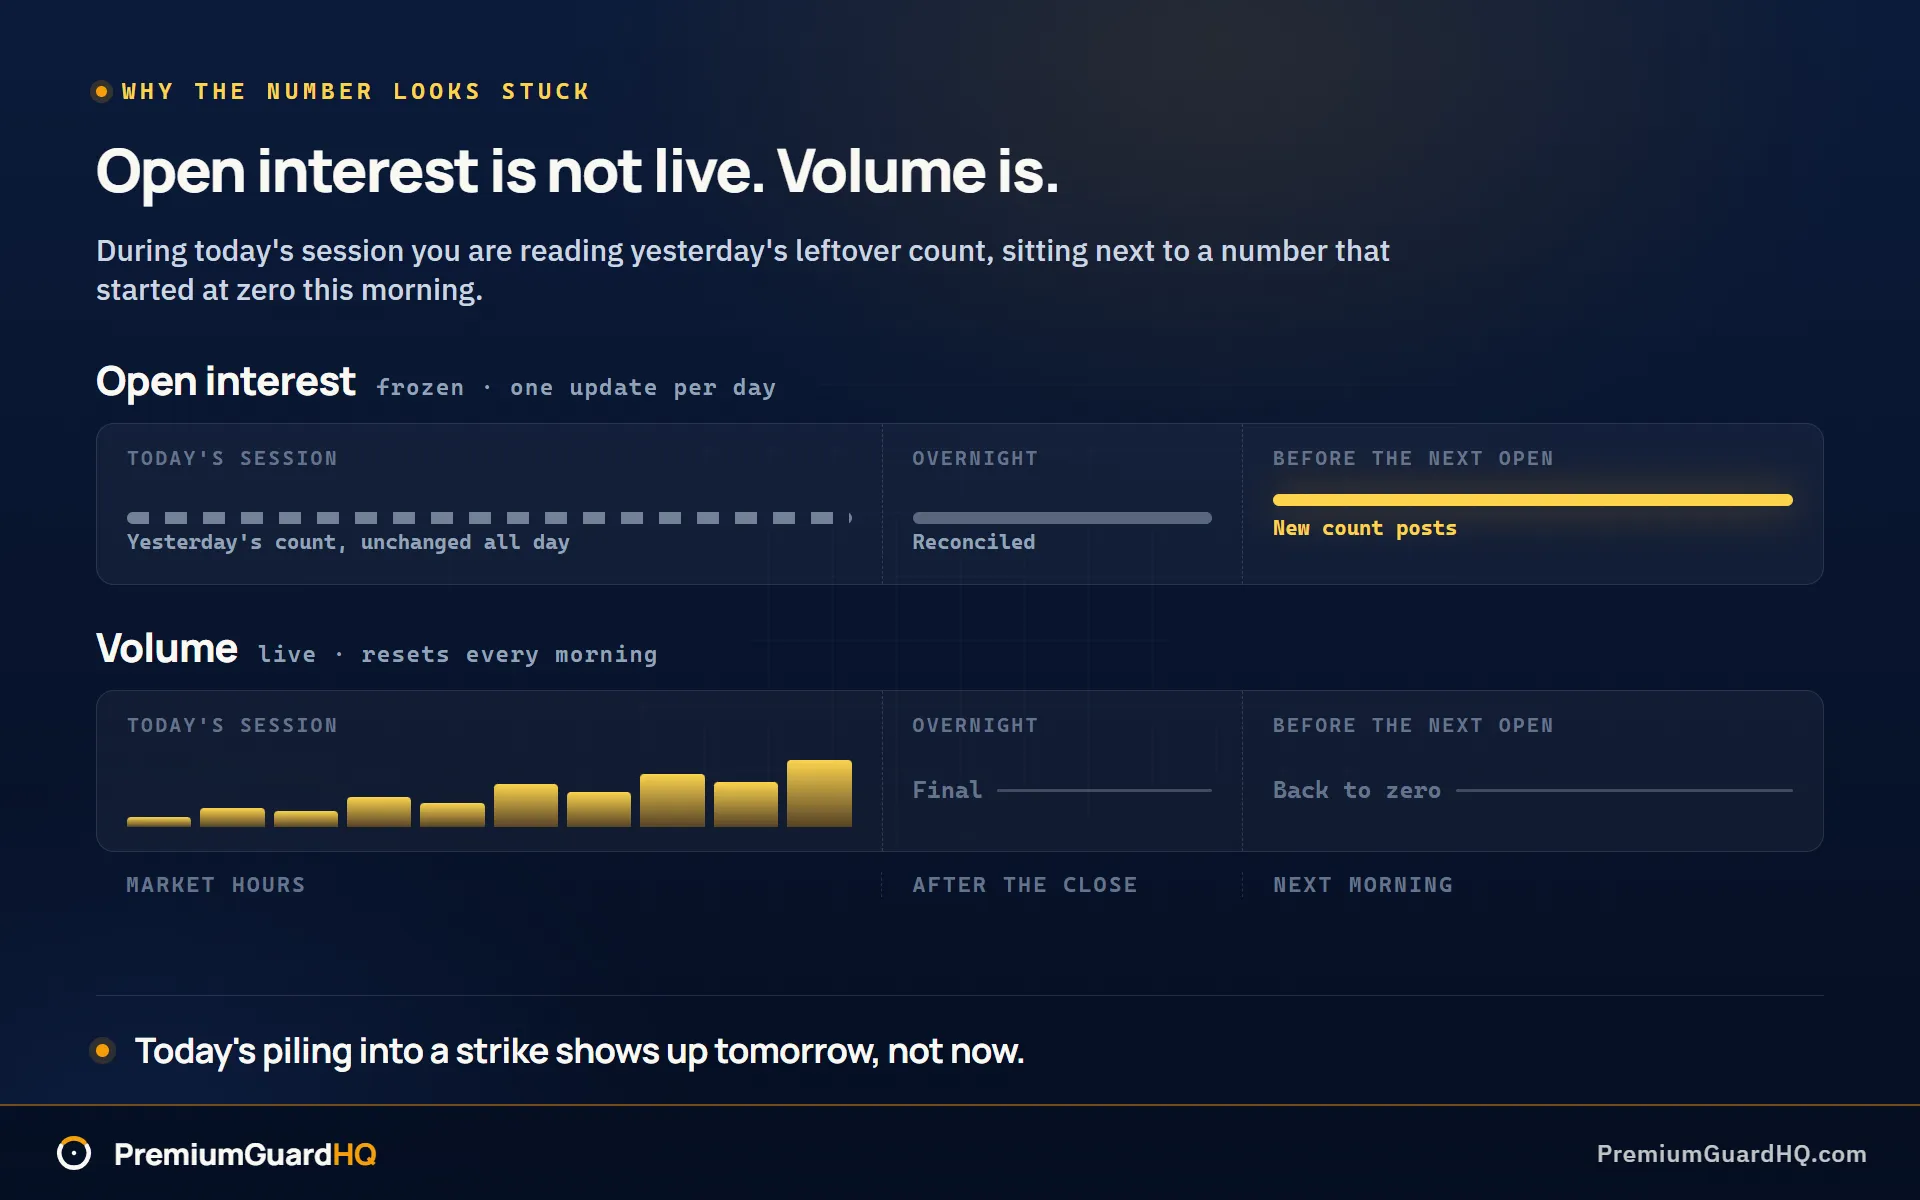
Now for the timing detail that trips up almost everyone. Open interest is not live. It does not update while the market is open today. The number you see right now was finalized after yesterday’s session closed, reconciled overnight, and posted before today’s opening bell. What you are looking at during today’s session is effectively yesterday’s leftover positions, frozen in place.
This means you cannot use today’s open interest to judge today’s activity. If a stock has big news this morning and traders are piling into a certain strike right now, open interest will not show that yet. You will only see it reflected tomorrow morning, once today gets reconciled overnight.
What this means if you are running the wheel: open interest is a starting map of who is already parked in that contract. A strike is a set price written into the contract. It is not a promise that you will get a fair price if you try to trade it this second. If you are opening or closing a position today, you still need to check the live market. Look at the bid-ask spread, which is the gap between the buy price and the sell price. Check whether fills are landing near the midpoint of that gap, and whether contracts are actually trading on that line right now.
Here is the misuse to avoid. Many traders see open interest tick up and assume it is bullish, meaning they think more people are betting the stock goes higher. That is guessing. Rising open interest just means new contracts got created. It says nothing about whether that flow was people opening bets or closing them out, and nothing about which direction anyone expects the stock to move.
The better read: treat open interest as how many contracts exist for you to trade against. Treat today’s volume, meaning how many contracts have actually traded so far today, as whether anyone is trading this thing right now. You need both answers before you trust a fill.
Before you sell any contract, run this short check:
- Check open interest for that exact strike and expiration date.
- Check today’s volume on that same line.
- Check the bid-ask spread width.
- Confirm you can close the position later with a limit order near the midpoint, without chasing the price.
Skip any one of these and you are guessing about liquidity instead of checking it.
Open interest vs options volume: what each number tells you about liquidity
Here is the one-sentence version. Open interest is the number of contracts still open from before today. Volume is how many contracts traded today. Open interest updates once a day. Volume starts back at zero every morning.
Here is a simple way to picture both at once. Open interest is inventory. Volume is turnover. Think of a store shelf. Open interest is how many boxes sit on the shelf right now. Volume is how many boxes a customer actually bought today. A shelf can be full with nobody shopping. A shelf can also empty out fast even if it started nearly bare. Liquidity means it’s easy to buy or sell at a fair price. You get the best liquidity when you have both: plenty of inventory, and steady turnover of that inventory day after day.
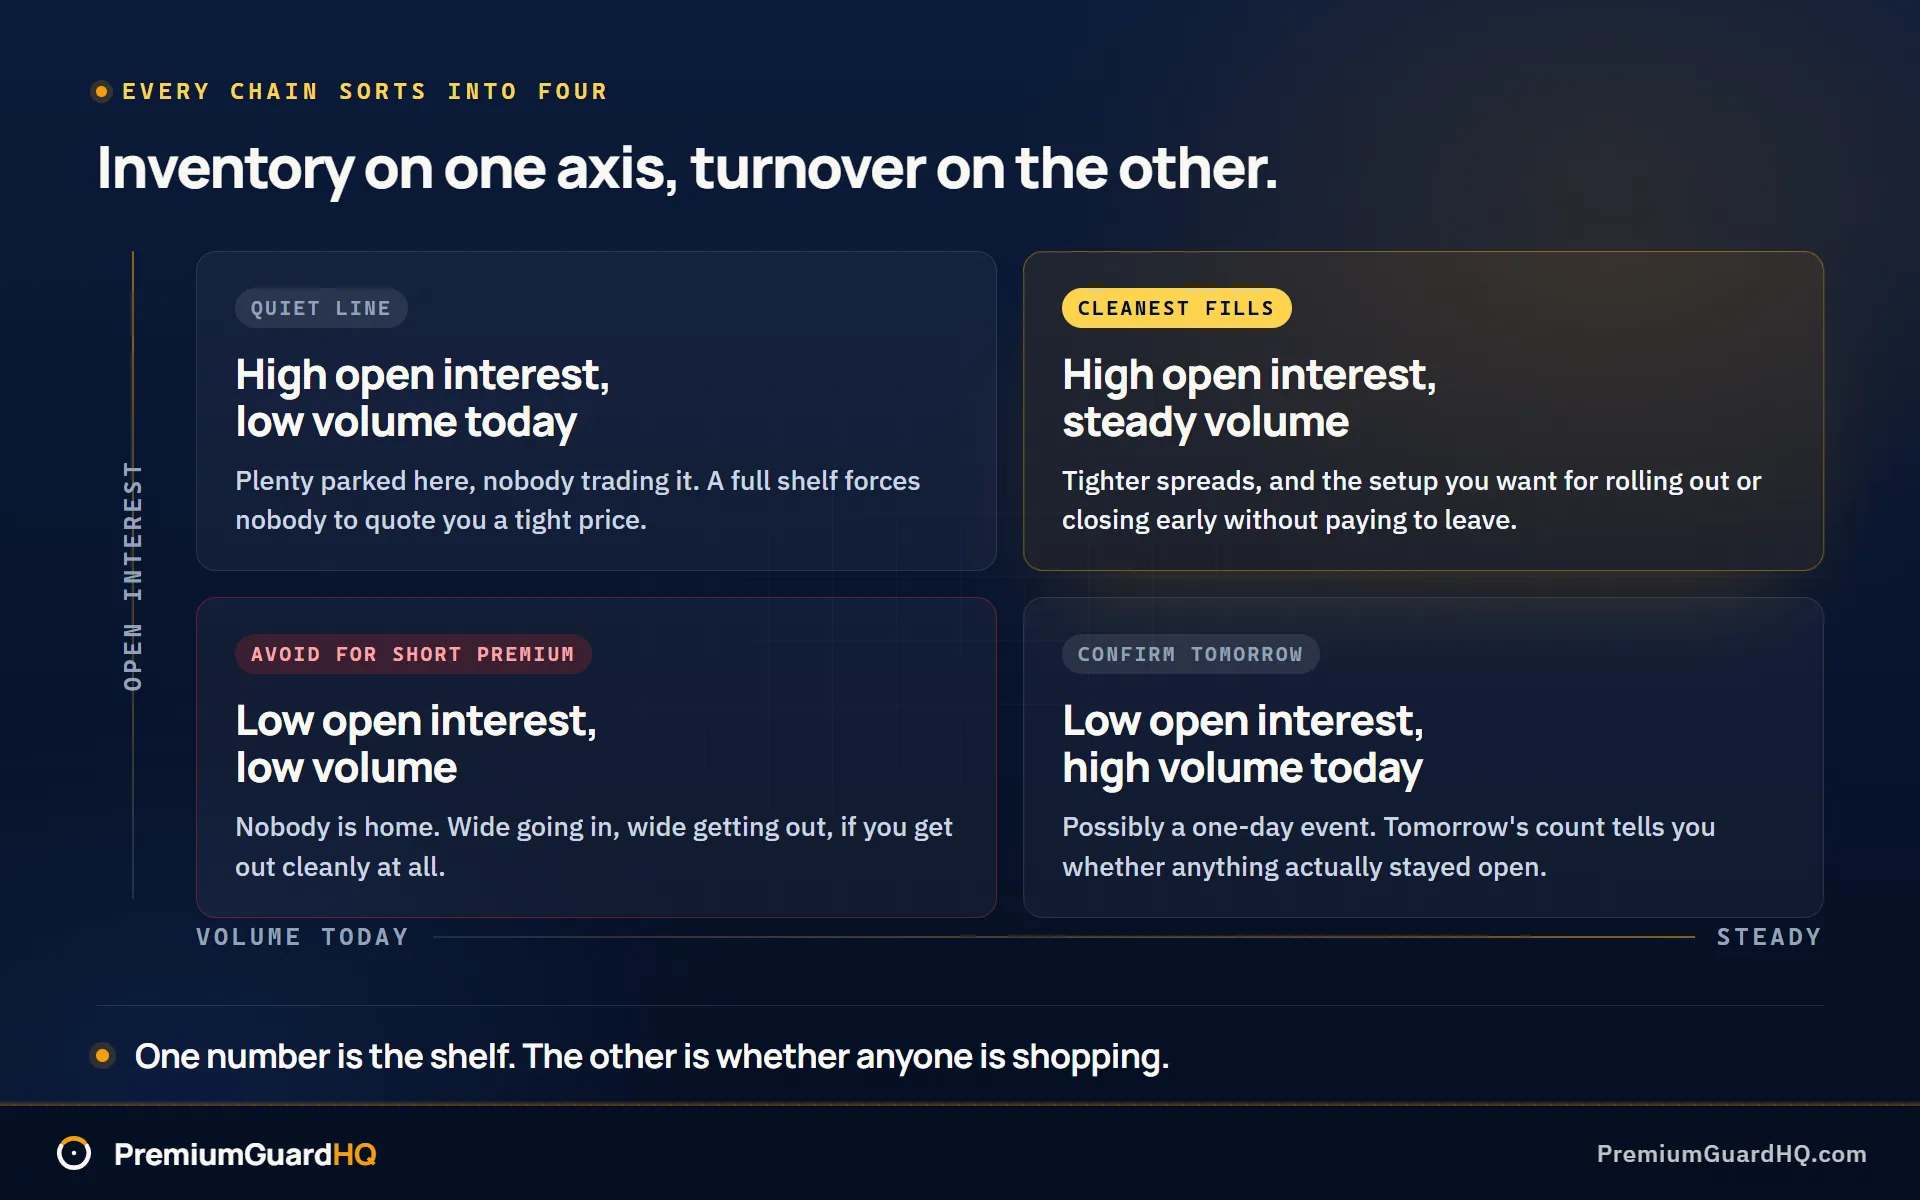
Once you hold that picture, every options chain sorts into four patterns.
High open interest, steady volume. This is the cleanest setup. Lots of contracts already parked on that line, and people trading it every day, not just today. This usually means a tighter bid-ask spread, so the gap between the buy price and the sell price stays small. This is the best setup for rolling a position, which means closing it and opening a new one further out, or for closing early without giving away extra money to do it.
High volume, low open interest. This can be a one-day event. A stock had news, and one strike suddenly saw heavy trading. Sometimes that turns into tomorrow’s open interest, once new positions get counted overnight. Sometimes it was mostly people closing out or rolling existing trades, so the shelf ends up just as empty as before. Treat a spike like this as a sign people are paying attention, not automatically a sign this contract is easy to trade.
Low volume, high open interest. A big but quiet line. Plenty of contracts exist, but almost nobody is trading it today. Do not assume that big number alone guarantees a fair fill. You can still hit a wide bid-ask spread in the middle of the day, because open interest alone does not force anyone to quote you a tight price. Nobody has to trade with you just because the shelf is full.
Low volume, low open interest. Skip this one for short premium. Short premium means selling puts or calls to collect payment upfront. Nobody is home on this line. You will likely pay a wide spread going in and a wide spread getting out, if you can get out cleanly at all.
| Pattern | What it usually means |
|---|---|
| High OI, steady volume | Cleanest fills, tighter spreads, good for rolling or closing early |
| High volume, low OI | Possible one-day event; confirm tomorrow once OI updates |
| Low volume, high OI | Quiet line; can still have wide spreads intraday |
| Low volume, low OI | Poor fills likely; avoid for short premium |
This is also what explains unusual options volume, a term you will see all over scanners and options volume trackers. Usually it is a ratio story. The scanner compares today’s volume to that contract’s normal volume, or compares today’s volume to its open interest. A ratio far above normal gets flagged as unusual.
Here is the part most scanners leave out. A volume spike can mean people are opening new positions. It can also mean people are closing old ones. Both look identical on a volume chart. You will not know which one happened until tomorrow, when open interest updates and either confirms new positions got added or shows the count barely moved. Unusual volume tells you something happened. It does not tell you what happened until the next day’s open interest fills in the rest of the story.
So how does this change what you actually do when selling covered calls or cash-secured puts? A cash-secured put is a promise to buy 100 shares at a set price, backed by cash you already set aside. A covered call is a promise to sell shares you already own, at a set price. Your profit on either trade is the payment you collect upfront, minus friction. Friction means the bid-ask spread plus slippage, the extra cost of paying more than you should just to get filled. Both quietly shrink your income.
Use open interest to steer around thin contract lines, where you might struggle to buy back the option and close early if you need to. Use volume to steer around strikes that look fine on paper but simply are not trading today. Together they answer the only question that matters for a premium seller: can you get in and out near the middle of the spread, on your own schedule, instead of the market’s?
None of this predicts a squeeze or guesses where a stock goes next. The goal is boring on purpose: reliable fills near the midpoint, and the ability to close the trade early if the risk changes.
One rule to carry forward. If open interest is low, you are negotiating. If volume is low, you are waiting. If both are low, you are donating your edge to whoever is willing to trade with you.
Frequently asked questions
Why can options volume be higher than open interest?
Volume counts every contract traded today, even if the same contract changed hands several times. Open interest is a net count of contracts still open from before today, updated once per day. A busy day of trading can push volume well past open interest, especially if traders are opening and closing the same line repeatedly. That volume only turns into higher open interest tomorrow if the day’s trades were mostly new positions opening, not old ones closing out.
Does high open interest always mean tight bid-ask spreads?
No. High open interest usually helps, but it does not guarantee a tight spread today. The gap between the buy price and the sell price is a live market condition, and it can widen even on a line with plenty of contracts parked on it. Always check the actual quote before you trade: spread width, how much size is quoted on each side, and whether limit orders near the midpoint are actually filling.
When does open interest update, and why does it look stale during the day?
Open interest updates once per day. The prior session gets reconciled overnight, and the new count posts before the next market open. This is why open interest looks stuck during the trading day. You’re really looking at yesterday’s leftover count, sitting next to today’s live volume. See “How open interest actually changes and when the number updates” above for the full breakdown.
How should a premium seller use OI and volume to avoid bad fills?
Use open interest as your first filter and skip contract lines with thin counts. Then use today’s volume and the live bid-ask spread as your second filter, since a strike can have solid open interest but simply see no action today. Finally, place limit orders near the midpoint and confirm you can close the position later without giving up much. Only size up once both checks come back clean.