
You found a screener that ranks “stocks with highest implied volatility.” The premiums look like rent checks. High implied volatility stocks hand you fat option credits compared to some sleepy blue chip stock.
Here’s the catch nobody puts on the screener page. High IV can mean the options are simply overpriced and ripe for selling. It can also mean the market expects a violent move. That kind of move can assign you stock during a real drop and break your wheel at the worst price.
By the end of this, you’ll know what high IV actually signals. You’ll also learn how to compare it fairly across stocks and how to spot the catalyst hiding behind the number before you sell into it.
Here’s the definition.
What are high implied volatility stocks
High implied volatility stocks are stocks whose options are pricing in a bigger than normal price swing. Traders pay more for these options because the market expects a wide move before expiration. High implied volatility points to size, not direction, and it only matters once you compare it to that stock’s own past.
That last part trips up almost everyone. Implied volatility, or IV, is a number pulled from option prices, not from the stock chart itself. It gets stated as a yearly percentage, even for options that expire next week. A stock can look “high IV” for two very different reasons.
- It is always a wild stock. Small biotech companies and meme stocks often run hot IV every single day, with or without news.
- Something specific is coming. Earnings, a court ruling, an FDA decision. Premium jumps right before the event and often drops right after. Traders call this drop IV crush.
You will also see two other terms used alongside IV: IV rank and IV percentile. Both tools answer the same question. Is this number high for this one stock, or just high compared to stocks in general? The next section shows you how to use them.
Where IV sits also shapes which structure fits. High IV pays sellers more, which favors strategies that collect cash upfront, while low IV makes the trades you buy cheaper.
How to read high IV options on a stock: expected move, time, and context
IV, short for implied volatility, is the market’s guess at how far a stock’s price could swing. It does not guess up or down. Think of it as a price tag the market puts on uncertainty. A high price tag means traders expect a bigger swing than normal.
Here is how you turn that percentage into a dollar amount.
Expected move ≈ Stock price × IV × √(DTE / 365)
DTE means days to expiration. That is how many days are left until the option contract ends. You take the square root of that fraction because volatility grows slower than time does, the same math used across the industry to size up a stock’s expected move.
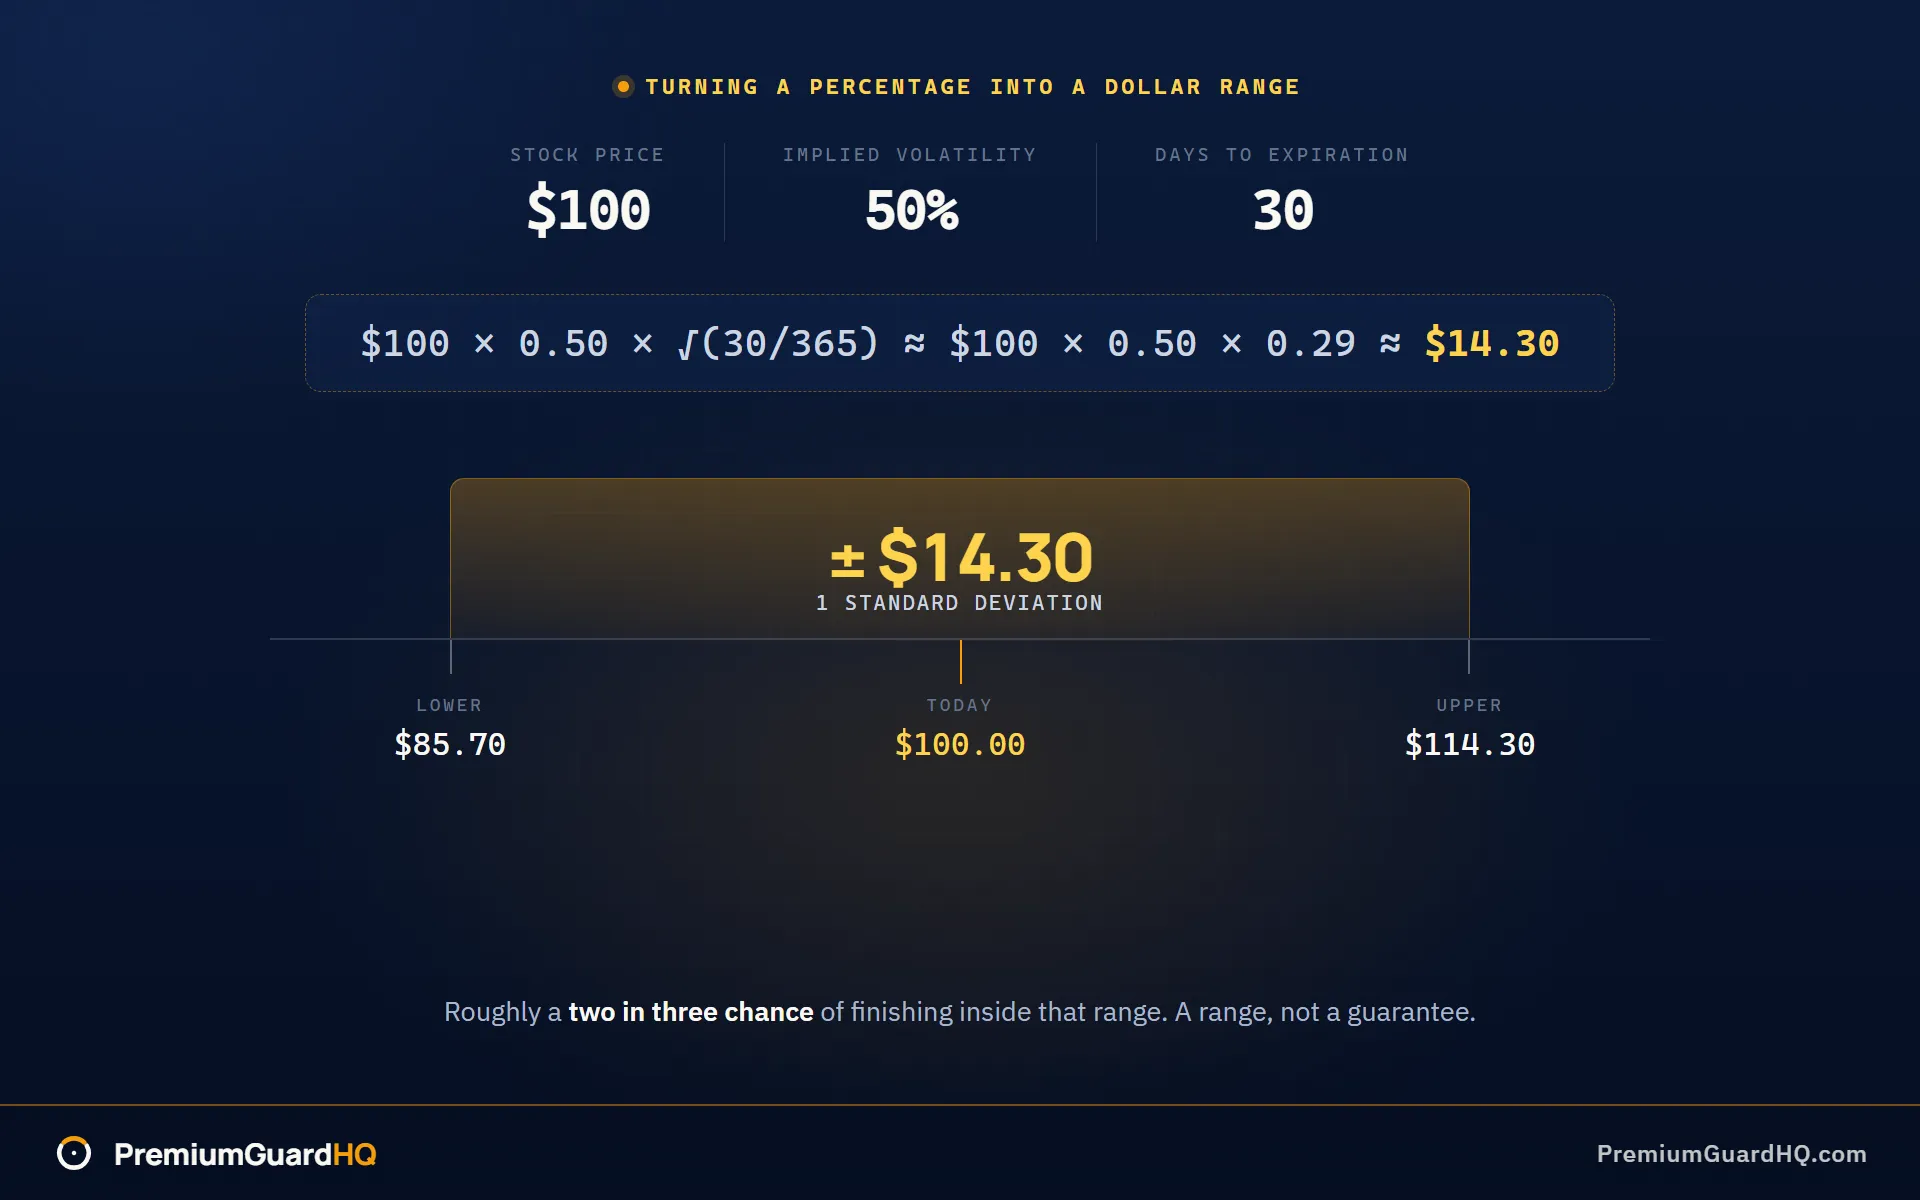
Say a stock trades at $100. Its IV reads 50%. You are looking at options that expire in 30 days.
Expected move ≈ $100 × 0.50 × √(30/365) ≈ $100 × 0.50 × 0.29 ≈ $14.30
That $14.30 is a 1 standard deviation move. In plain words, the stock has roughly a two in three chance of landing between $85.70 and $114.30 by expiration. That is a range, not a guarantee. The stock can still blow past it. A shorter expiration shrinks that dollar range, since there is less time for the price to wander. It does not shrink the odds of a sudden gap on any single day, including the day earnings come out.
Here is the part that catches new sellers off guard. Option prices drive IV, not the other way around. IV is calculated from what people are actually paying for options right now, not from some independent forecast beamed down from a research desk. When traders rush to buy puts and calls ahead of an event, out of fear, hedging, or plain speculation, prices rise, and the IV number rises right along with them. High IV is frequently a symptom. It means the market is pricing in a specific reason the stock might jump.
That number alone does not tell you if today’s IV is normal for this stock or unusually stretched. You need one more layer: how does this reading compare to the stock’s own history? That is exactly what IV rank and IV percentile answer. Rank tells you where today sits between the stock’s lowest and highest IV over the past year. Percentile tells you how many of the past year’s days had a lower IV than today. The next section walks through both.
Before you look at premium, run a quick catalyst check. Is there an earnings report landing inside your expiration week? That is the most common trigger. Also check for FDA or biotech data readouts, court rulings, merger and acquisition rumors, or macro-sensitive names reacting to Fed news. High IV is often the market plainly telling you there is a real reason this stock might gap.
That matters directly for how you run the wheel, a strategy that cycles between selling puts and selling calls on the same stock. Assignment means you are required to buy the stock, because you sold a put, or sell it, because you sold a call, at your agreed price. Assignment is the pricing mechanism working exactly as designed, not some rare misfortune that only happens to unlucky traders in high IV names. The fat premium and the real chance of assignment are two sides of the same coin.
If assignment anxiety drives your strike choices, read our options wheel strategy guide for the assignment mechanics and cost-basis reality.
Now that you can put a dollar figure on the expected move and know why the catalyst behind it matters, the next step is learning the two tools that give that number context: IV rank and IV percentile.
IV rank vs IV percentile: what each number actually tells you
Here’s a problem you’ll run into fast. Two stocks can both show “80% IV” on a screener. IV stands for implied volatility, the market’s guess at how much a stock’s price swings over time. That sounds like the same thing twice. It isn’t. One stock might be sitting at its normal, everyday level of jumpiness. The other might be more stretched than it’s been all year. The raw IV number can’t tell those two situations apart. You need two other tools for that: IV rank and IV percentile.
IV rank answers one question. Where does today’s IV sit between this stock’s lowest and highest IV over the past year? Here’s the formula in plain words.
IV rank = (Today’s IV − 52-week low IV) ÷ (52-week high IV − 52-week low IV) × 100
A reading of 0 means IV is near the year’s low point. A reading of 100 means IV is near the year’s high point. If a stock shows an IV rank of 20, today’s IV is close to the calmest it’s been all year, even if the raw IV number itself looks big.
IV percentile answers a different question. Out of the last year’s trading days, what share of them had a lower IV than today? If a stock sits at the 90th IV percentile, IV has been lower than today on about 90% of days over the past year. Today is rare, not just elevated.
These two numbers can disagree on the same stock at the same time, because they’re built differently. IV percentile counts how often IV has been below today’s level. It’s frequency-based. IV rank measures how far today sits between the year’s floor and ceiling. It’s range-based.
Here’s how that plays out. Say a stock had one scary day eight months ago, a single news shock that sent IV to an extreme spike. That one day stretches out the 52-week high. Today’s IV, even if it feels elevated, can look only middling on the rank scale, because the range it’s measured against is now huge. Flip that around. A stock that runs warm and choppy almost every day, without ever spiking, can show a high IV percentile, since most days really were calmer than today, even though the 52-week high isn’t far off at all.
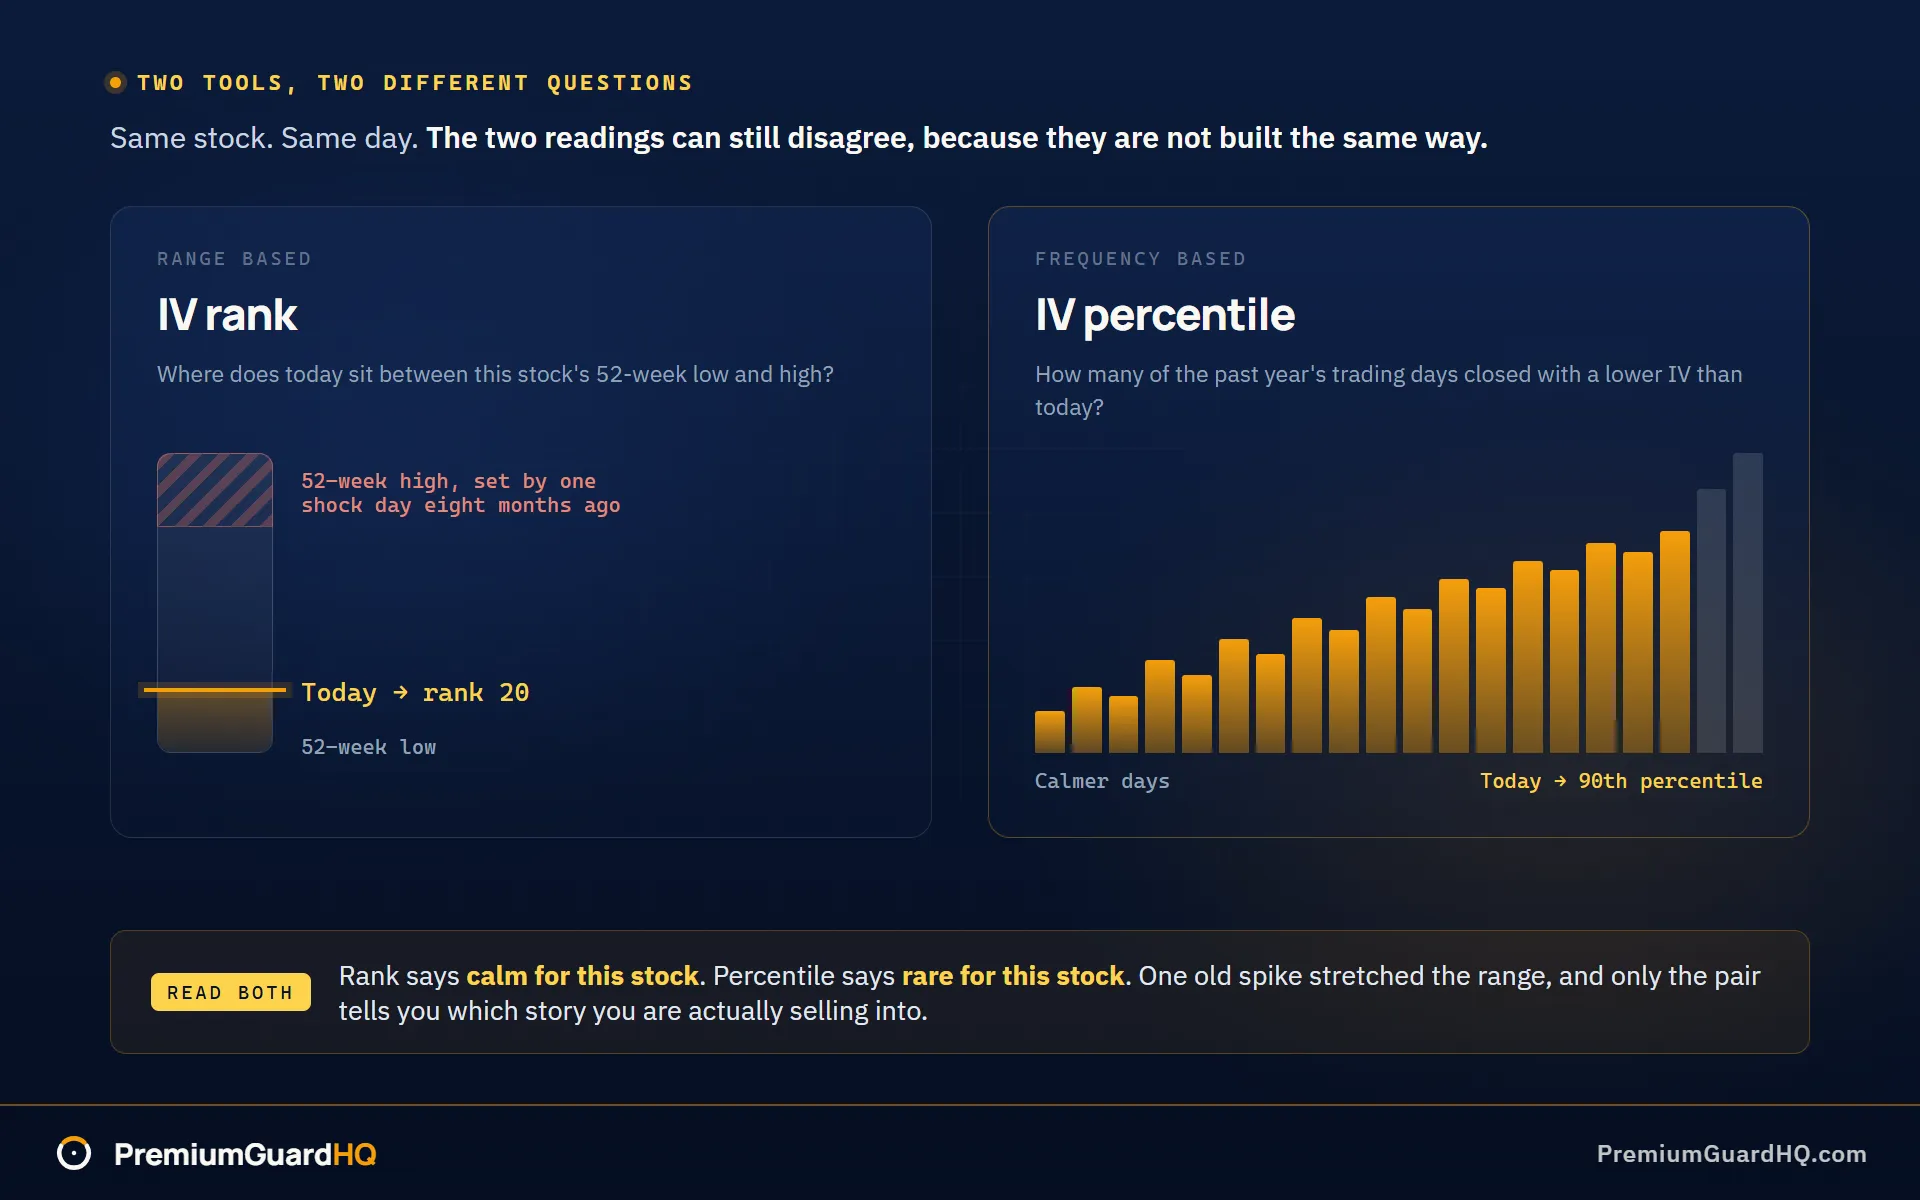
That difference is why both numbers earn a place on your checklist. IV rank is good at spotting a stock that looks stretched relative to its own yearly range. IV percentile is good at spotting a stock where today is genuinely rare compared to its typical days. Together, they separate two stories a single raw IV number blends into one: a stock that’s “always volatile” versus a stock that’s “expensive right now.”
Here’s one practical reading rule, offered as a habit, not advice. Many traders who sell options for income prefer setups where IV is elevated compared to the stock’s own past, not simply high in absolute terms. A stock with 40% IV and a high rank can be a more interesting setup than a stock with 90% IV and a low rank. The second one is just behaving normally for itself.
Treat a high rank or high percentile reading as a prompt to dig deeper, never as a green light on its own. The next question is what the market actually knows that’s pushing that number up. That decides your real risk of assignment, the possibility your shares get bought or sold from under you, and how deep a drawdown could cut.
Why high IV usually means the market knows something
Here’s the part a screener will never tell you. The market doesn’t hand out fat premiums because it likes you. High implied volatility, or IV, is the market’s guess at how much a stock will swing. It’s a price tag on real risk. When you sell an option, you get paid for stepping in front of something. Find out what that something is before you collect the premium.
Three situations show up again and again behind high IV readings.
Earnings and guidance. IV climbs in the days before a company reports earnings, because nobody knows what the numbers will say. Right after the report, IV usually drops fast. Traders call this IV crush. If you sold a put the week before earnings, you got paid for that uncertainty. If the stock gaps down 15% on bad guidance, that premium covers only a small slice of the loss.
Biotech and regulatory events. Drug trial results and FDA decisions are binary. The stock either jumps or craters, often 30% to 60% in a single session, with almost nothing in between. Options in these names carry sky-high IV in the days before the announcement. The market is pricing two very different outcomes, not one calm outcome with some wiggle room.
Litigation, financing worries, and takeover rumors. A pending lawsuit, a company running low on cash, or buyout chatter all create the same pattern. A headline can hit at any moment and reprice the stock in seconds. There’s no scheduled date to circle on a calendar. That makes this category harder to prepare for than earnings or a trial readout.
Now translate that into what actually hurts.
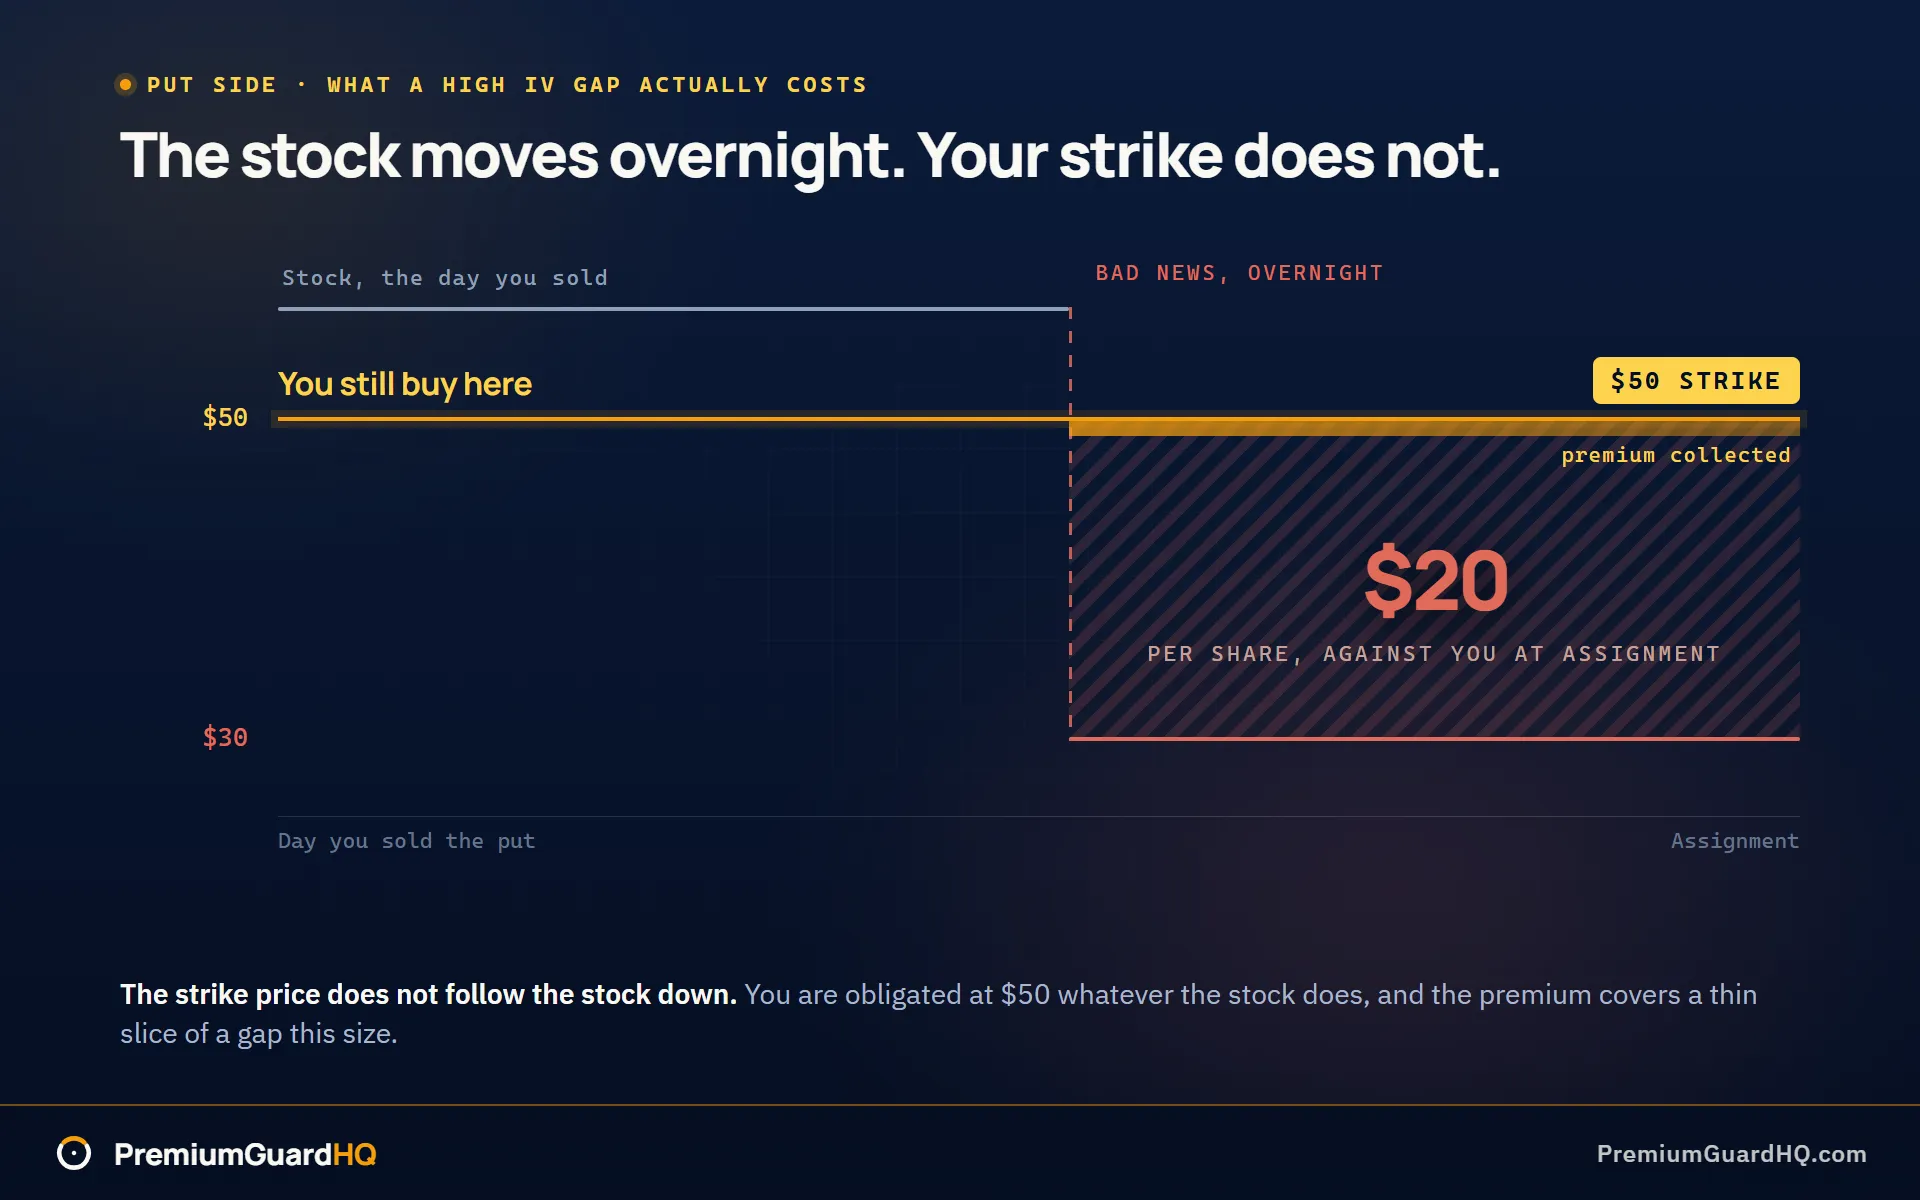
On the put side, assignment means you’re required to buy 100 shares per contract at your strike price. That’s the deal you made when you sold the put, and assignment can land any time before expiration. The strike price does not follow the stock down. If you sold a $50 put and the stock gaps to $30 overnight on bad news, you still buy at $50. You’re now sitting on a loss that premium alone won’t fix for a long time.
On the call side, getting your shares called away is not the disaster. Called away means your shares get sold at your strike price. The real disaster happens before that call ever gets sold: you get assigned stock during a high IV gap down, then spend months selling covered calls just trying to climb back to breakeven. That’s the wheel strategy, the cycle of selling puts and calls on the same stock, working against you instead of for you. Premium is not profit the moment it lands in your account. It only becomes real profit once the full cycle closes, and the cycle closes on your exit, not on the day you opened the trade.
So how do you tell “always wild” apart from “wild right now”? Pull the tools from the last section. Check IV rank and IV percentile first. Then add one more gut check. Compare IV to HV, or historical volatility, meaning how much the stock has actually moved recently. If IV sits far above HV, options are pricing in more movement than the stock has actually been showing. That gap is often where a catalyst is hiding.
Before you sell into a high IV reading, run through this:
- Event calendar. Is earnings inside your expiration window? Any scheduled announcements?
- News and filings. Recent guidance changes, financing news, regulatory updates?
- Options market quality. Are the bid-ask spreads tight enough that you could actually exit without giving away your edge?
- Concentration risk. If this position assigns, does it become a problem sized for your whole portfolio, not just one trade?
Assignment doesn’t have to feel like a crisis. Our guide to the assignment mechanics walks through what happens to your cost basis and how assignment affects the cash you have free to trade elsewhere.
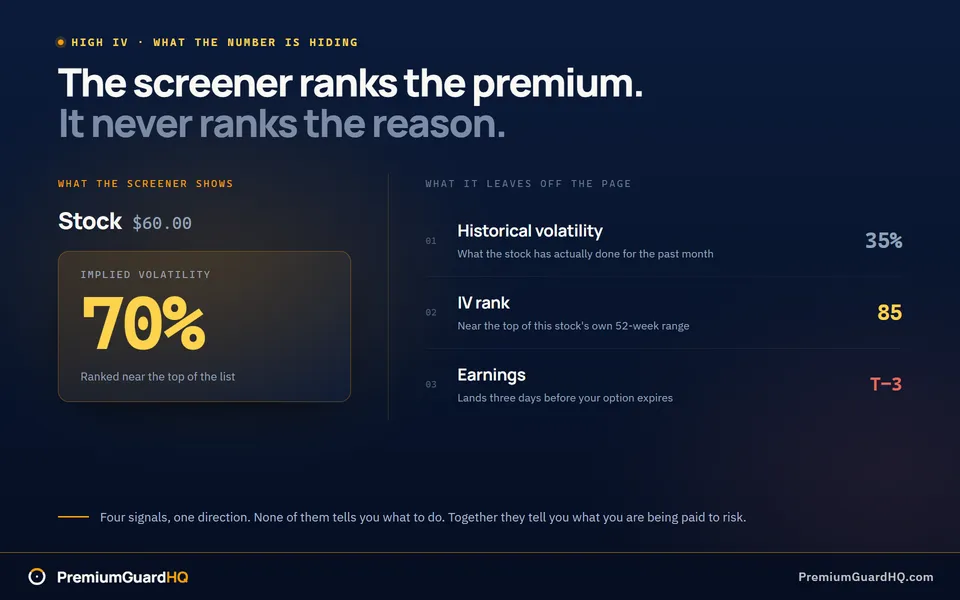
Here’s how it all fits together. Say a stock trades at $60. IV reads 70%, HV over the past month sits at just 35%. IV rank is 85. Earnings land three days before your option expires. That’s four separate signals: expected move, rank, the IV-HV gap, and a real calendar event, all pointing the same direction at once. None of them tells you what to do next. Together, they tell you exactly what you’re being paid to risk.
Worked example: the same IV% can mean two very different trades
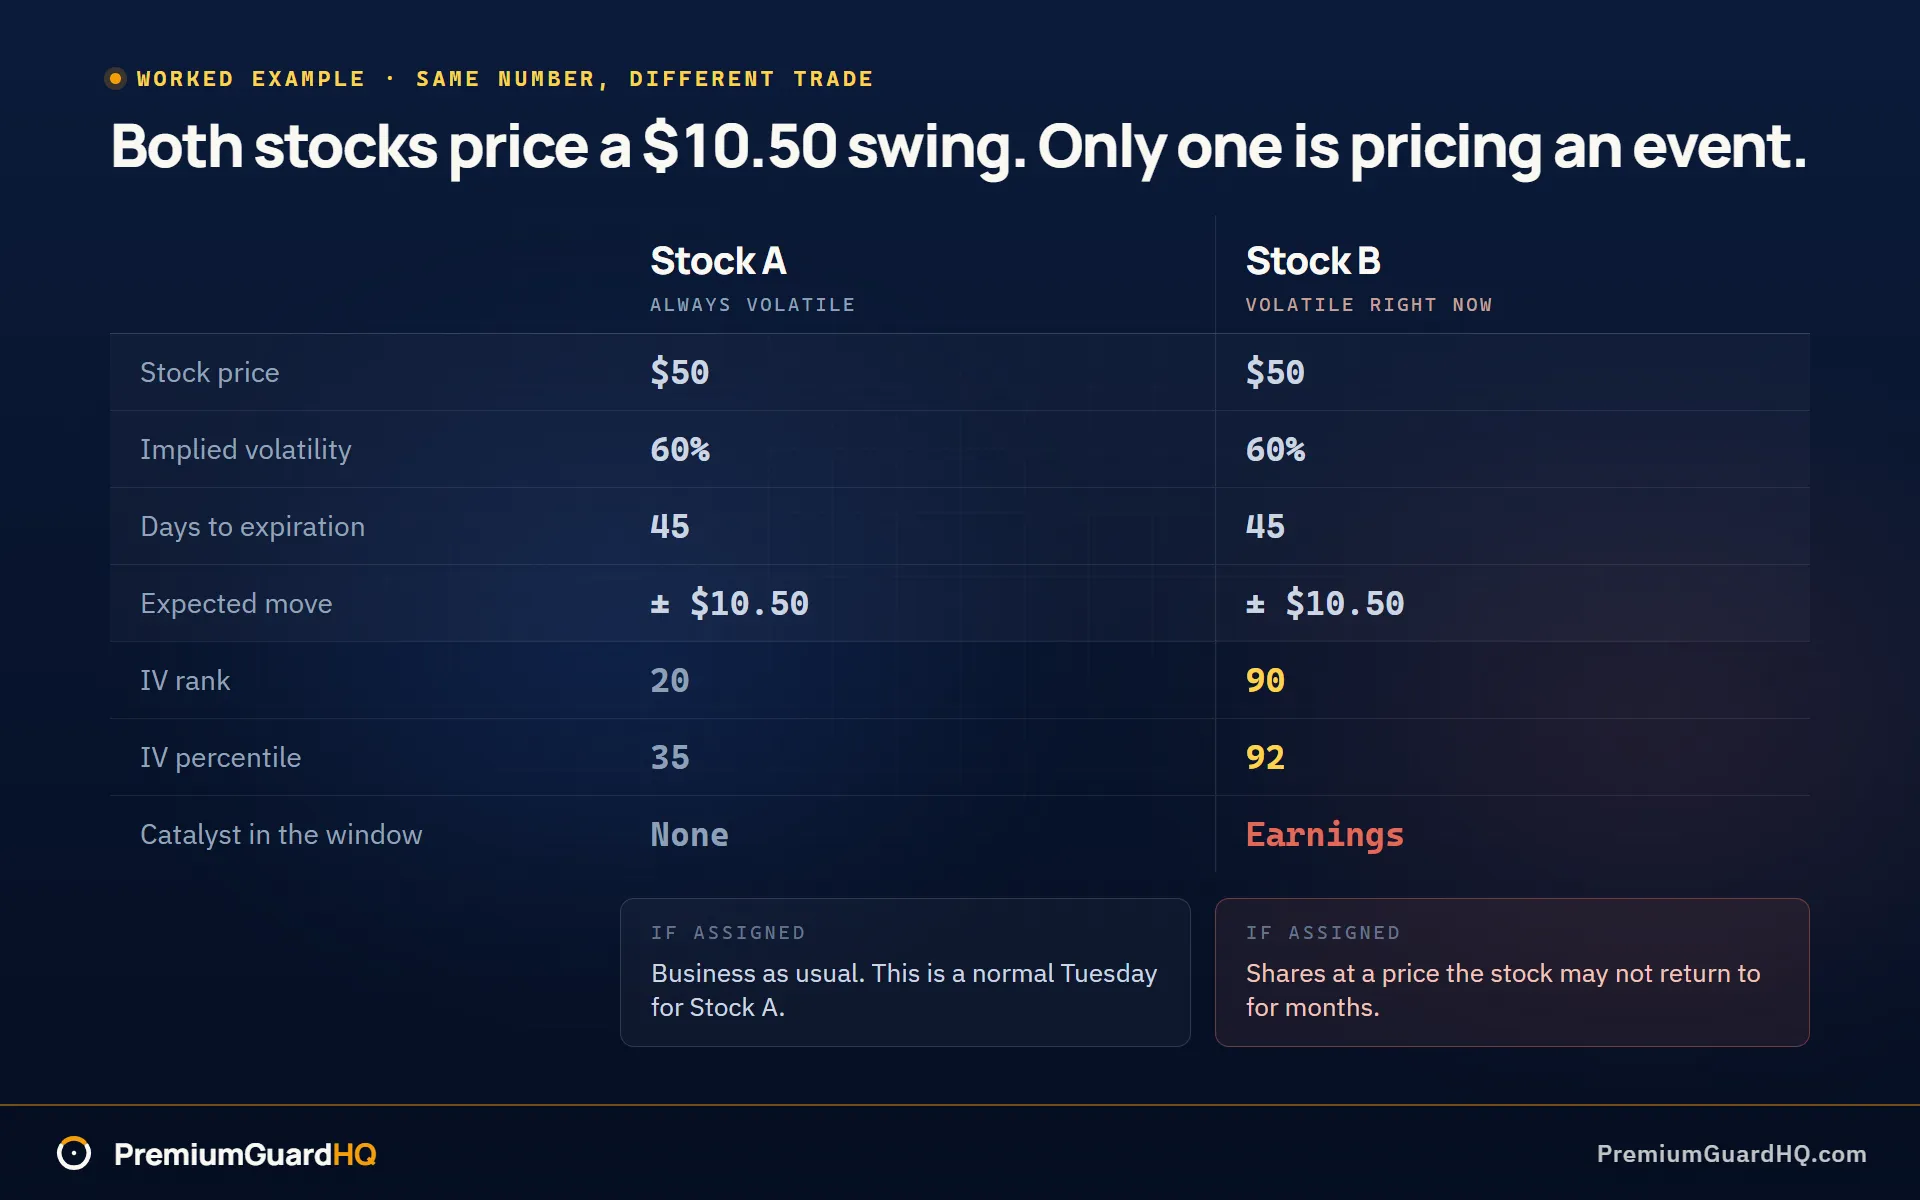
Two stocks make this easy to see. Call them Stock A and Stock B. Both trade at $50. Both show 60% IV on options that expire in 45 days. DTE means days to expiration, the number of days left before the option contract ends. On the surface, they look like the same trade.
Step 1: Do the math. Use the expected move formula from earlier in this article.
Expected move ≈ $50 × 0.60 × √(45/365)
The square root part works out to about 0.35. So the math becomes $50 × 0.60 × 0.35, which is about $10.50. Both stocks show the same expected move. The market is pricing a swing of roughly $10.50 in either direction by expiration, for both names. If you stopped here, you would think these two trades carry the same risk.
Step 2: Add the context. Stock A shows an IV rank of 20 and an IV percentile of 35. IV rank compares today’s IV level to that same stock’s own highs and lows over the past year. A rank of 20 means this 60% reading sits near the calm end for this stock. It runs hot most of the time, so this is just a normal Tuesday for Stock A.
Stock B shows an IV rank of 90 and an IV percentile of 92. That same 60% number is rare for Stock B. Something has pushed option prices far above where they normally sit.
Step 3: Add the catalyst. A catalyst is a known event that could move the stock. Stock A has no earnings report or known event landing inside this window. Stock B has one: earnings or a regulatory decision falls inside the 45 days.
Step 4: What this means for you. The expected move math came out identical for both stocks. The reason behind that math did not. Stock A is pricing in the way it always trades, nothing more. Stock B is pricing in a specific event that could send the stock jumping or dropping hard.
Right after that event passes, IV usually drops fast. Traders call this drop IV crush. For wheel traders, that changes what assignment actually means. Assignment on Stock A is business as usual. Assignment on Stock B, right after a binary event, can hand you shares at a price the stock never returns to for months.
Same 60% IV. Two completely different trades. Raw IV never tells the whole story by itself.
That leaves one open question: where do you actually check a stock’s IV rank and IV percentile, and what exactly happens during an IV crush? The FAQ below covers both.
Frequently asked questions
What is IV rank in options?
IV rank tells you where a stock’s current implied volatility, or IV, sits between its own highest and lowest points over the past year. IV rank hitting 0 means today’s IV is close to the calmest point the stock has seen all year. A rank near 100 means today’s IV is close to the stock’s yearly peak. Watch out for one thing: a single extreme spike, even from a year ago, stretches the whole range. That can make a genuinely elevated reading today look only middling on the rank scale.
What is the difference between IV rank and IV percentile?
IV rank measures where today’s IV sits between the stock’s 52-week low and high. It’s about position within a range. IV percentile measures how many of the past year’s trading days had a lower IV than today. It’s about frequency. The two can disagree on the same stock at the same time. When they do, that disagreement is worth digging into, since it usually means one old outlier day is skewing the range that IV rank depends on.
Where can I find an IV rank checker without a brokerage login?
Several web-based sites publish IV rank and IV percentile tables for free, including options-focused screener sites and market data pages that list volatility metrics alongside a stock’s ticker. Barchart and MarketChameleon are two commonly referenced examples. Whatever list you use, cross-check the stock against an earnings calendar before you act. A high reading next to an earnings date tells a very different story than a high reading with no event in sight.
Does high implied volatility mean options are overpriced?
Not necessarily. “Expensive” only makes sense relative to something, so start with IV rank and IV percentile rather than the raw IV number alone. It also helps to compare IV against HV, or historical volatility, which is how much the stock has actually moved recently. A wide gap between the two can flag richer pricing. But high IV is frequently just fair pricing for real, upcoming uncertainty, like an earnings report or a court ruling. The number itself isn’t lying to you.
How does high IV relate to assignment in the wheel strategy?
Assignment, meaning you’re required to buy or sell 100 shares per contract at your strike price, is a normal part of running the wheel. High IV simply raises the odds that the move behind that assignment is a large one. That’s because high IV is frequently tied to a specific event, like earnings or a regulatory decision, and events create gap risk: the stock can jump past your strike overnight, and the premium you collected won’t fully cover that gap. See our options wheel strategy guide above for the full breakdown of assignment mechanics and cost-basis reality.