
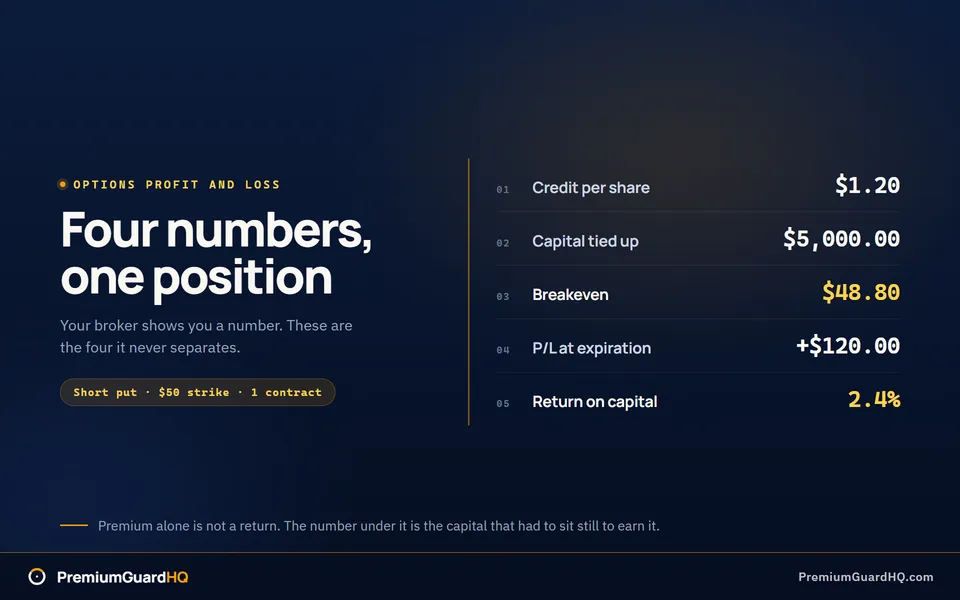
Your broker’s profit and loss screen is lying to you. Not on purpose, but it is. That number gets adjusted for wash sales and premium you already collected, so it rarely matches what you actually put at risk. And if you sold a covered call or a cash-secured put, most calculators online won’t even help you. A covered call means selling someone the right to buy stock you own, at a set price. A cash-secured put means selling the right to make someone buy your stock, while you set aside enough cash to buy it if needed. Most online tools are built only for buying calls and puts. They skip these two common trades entirely.
Here’s the problem. How to calculate options profit depends on which position you’re holding, your true cost basis, and how much cash or stock is tied up as collateral.
This guide shows you how to find four numbers: your real cost basis, your breakeven point, your profit and loss at expiration, and your profit and loss before expiration. You’ll also learn to turn that into an annualized return on capital, so you can compare trades fairly. This covers single-leg calls and puts, plus covered calls and cash-secured puts, the two most common ways traders sell premium. This is educational information, not trade advice.
Next, we’ll build a simple checklist. Pull the right numbers once, and you’ll never have to redo this math again.
Before you start: collect the exact inputs once
Bad math starts with bad inputs. Pull these numbers once, and every formula in this guide works on the first try.
Use your fills, not watchlist quotes. A fill is the price you actually paid or got paid when your order went through. Write down the stock symbol, call or put, long or short, strike price, expiration date, and number of contracts. Then record your fill price for each leg: the premium you paid, or the premium you received.
Confirm your contract multiplier. This is the number of shares each contract controls. Most U.S. stock options use 100 shares per contract. Some products, like mini options or certain index options, use a different multiplier. Check yours before you calculate anything.
Write down every cost you’ll subtract. That means commissions, per-contract fees, and exchange fees. Also note your slippage. Slippage is the gap between the price you wanted and the price you actually got. Did you fill at the mid price, the ask, or the bid?
If you sell options for income, record your tied-up capital. This is the cash or shares your broker locks up for the trade. For a cash-secured put, multiply the strike price by 100, then by your number of contracts. For a covered call, multiply your share cost basis by the number of shares you own. Most online tools skip this entirely, so use a calculator that handles sold options, not just bought ones to check both numbers against your own fills.
Pick how you’ll value an open position before expiration. The fast way is to use the option’s current mid price. The mid price sits halfway between the bid and ask. The more detailed way is to model it using Greeks. Delta tells you how much the option’s price moves when the stock moves a dollar. Theta tells you how much value the option loses each day just from time passing.
With these numbers in hand, you’re ready for step one.
Step 1: identify the position and compute the true cost basis
Before you calculate anything, name your trade in one short sentence. This name decides which formula you use for every number that follows.
Ask yourself: am I long a call, long a put, short a call, or short a put? Long means you bought the option. An option is a contract that gives you the right to buy or sell a stock at a set price. Short means you sold that contract instead. If this trade is part of a wheel cycle, get more specific. A wheel cycle is a strategy where you sell puts and calls again and again on the same stock. Call your trade a cash-secured put or a covered call. A cash-secured put is a short put backed by cash sitting in your account. A covered call is a short call backed by shares you already own. Write your label down. You will need it in every step that follows.
Now turn “premium” into real cash flow. Premium is the price you pay or collect for an option. The direction of that money flips depending on your label.
- If you bought the option (long call or long put), the premium is a debit. That means cash left your account.
- If you sold the option (short call or short put), the premium is a credit. That means cash came into your account.
Keep this straight. Buyers and sellers build their cost basis in opposite directions. Cost basis is just the true starting cost of your position, once everything is added up.
For buyers, your cost per share is simple:
Cost per share = premium paid + per-share feesFor sellers, your credit per share works the other way:
Credit per share = premium received - per-share feesKeep your signs consistent. A debit adds to your cost. A credit lowers it. Mixing these up is the most common way traders miscalculate a gain or loss later.
If you are a seller, you also need your capital base. This is the money or stock value tied up for the whole trade. You will divide by this number later to find your return on capital, which just means how much profit you made compared to how much money you had locked up. Get this number right now.
- Cash-secured put: strike price times 100 times number of contracts. The strike price is the price you agreed to buy the stock at if assigned. This is the cash your broker sets aside in case you get assigned the stock, meaning you are required to buy it.
- Covered call: pick one of two bases and stick with it for the life of the trade. Either use what you originally paid for the shares, or use what the shares were worth the moment you sold the call.
Here is where most traders get tripped up. Your broker’s cost basis screen often blends stock profit and option premium together. It may also fold premium into your basis in a way that hides it as income. Treat that number with suspicion. Use this framing instead: premium counts as unearned until the cycle closes, just cash sitting in your account until the trade is fully done. If you are running the wheel, an assigned put rewrites the basis again, and the ledger has to survive that.
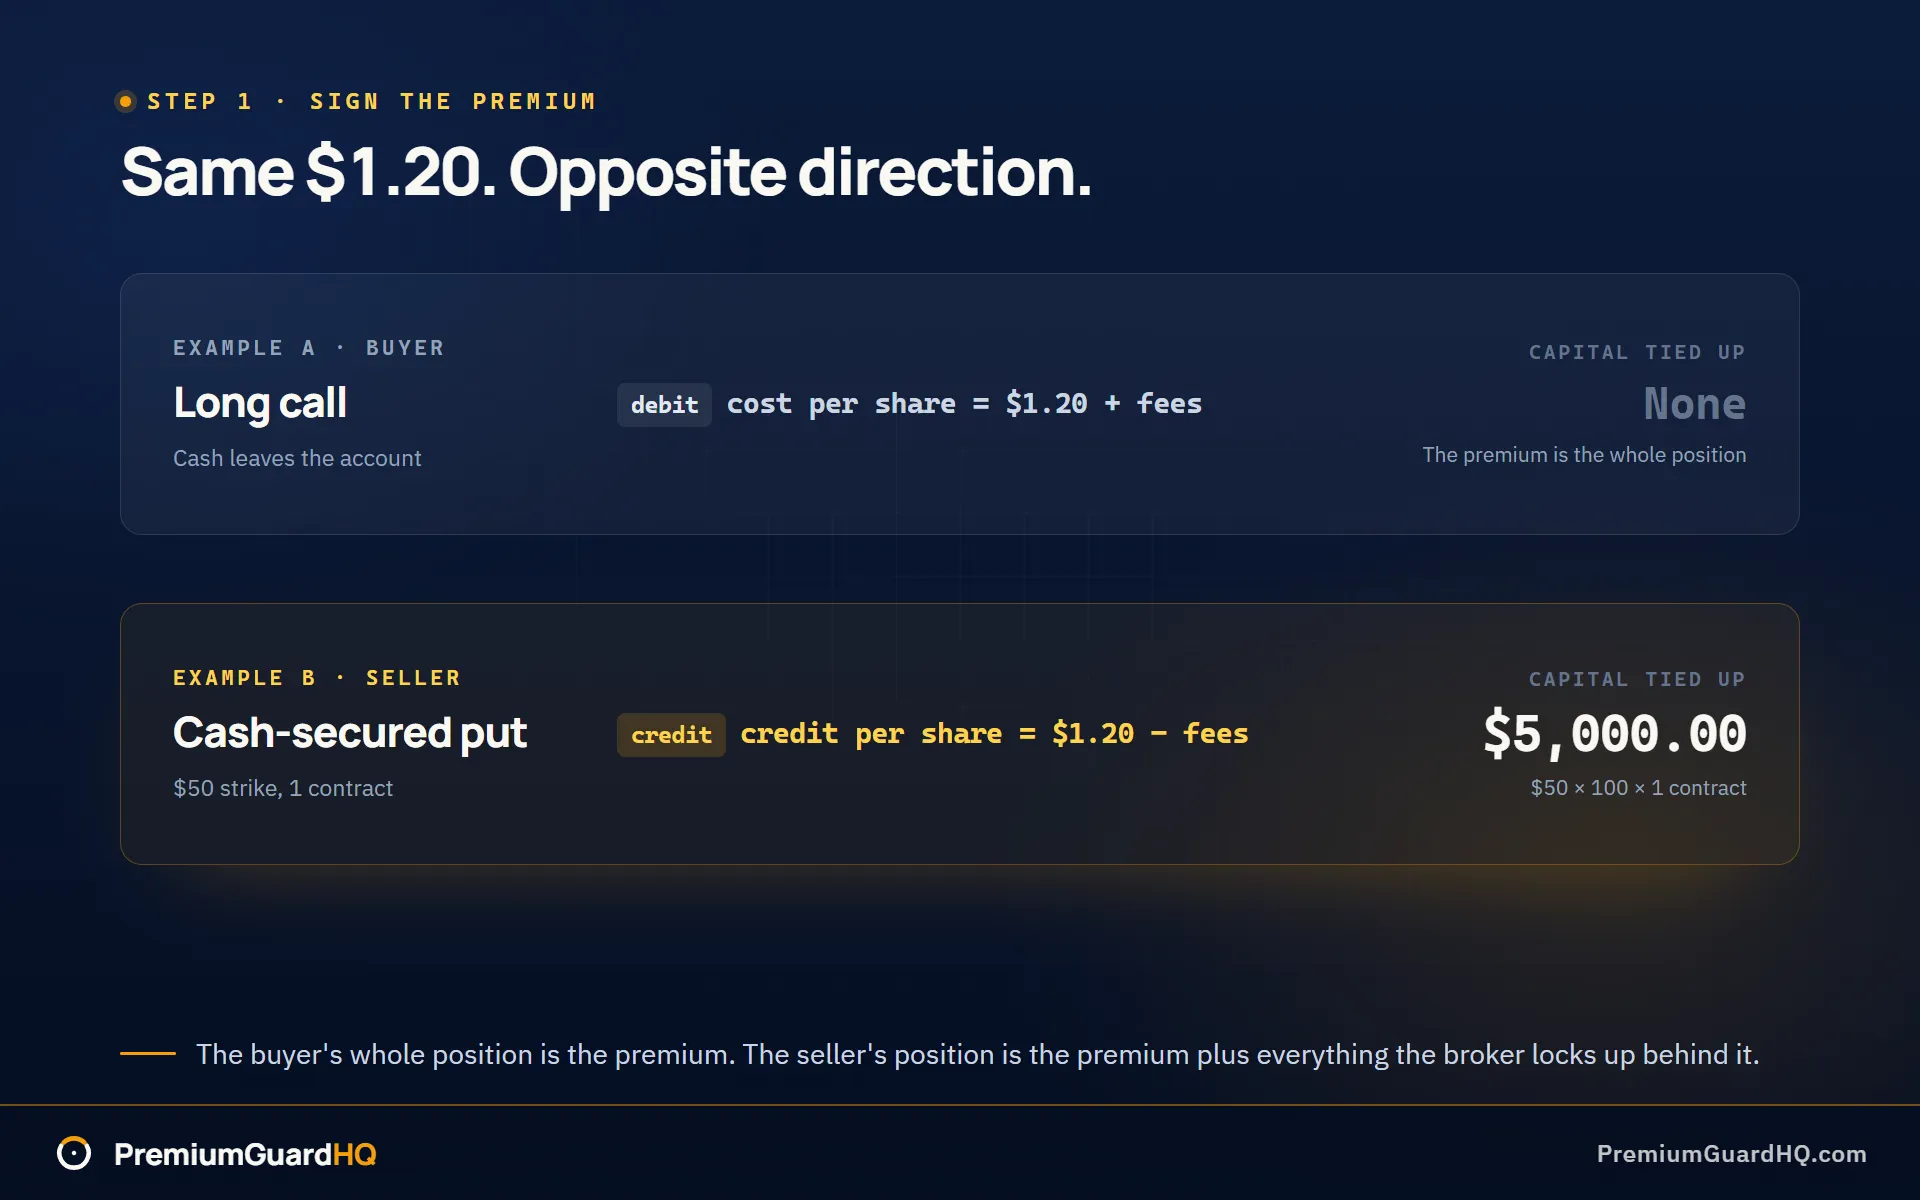
Example A, a long call: you pay $1.20 in premium per share for a call. Your cost per share is $1.20 plus fees. Nothing else is tied up beyond that premium.
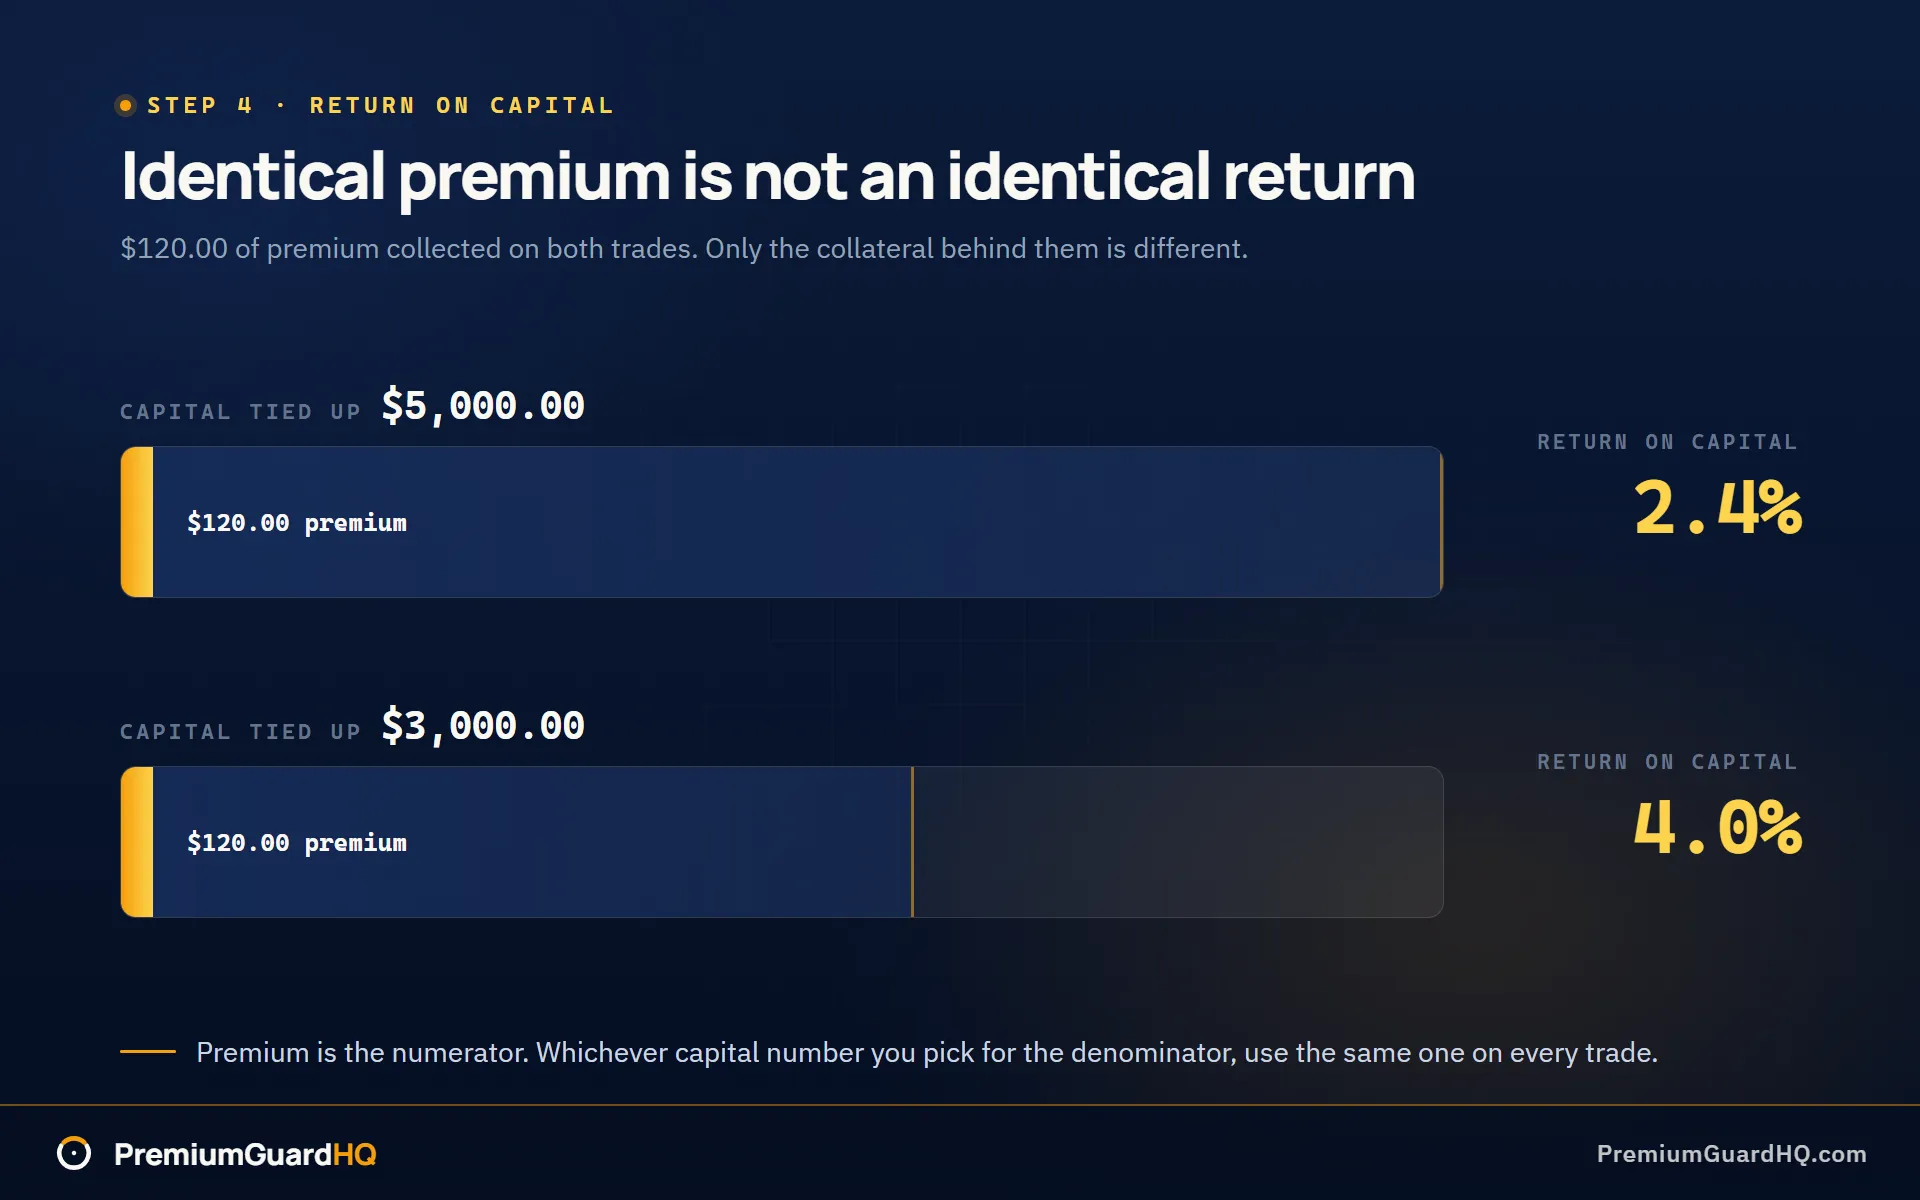
Example B, a cash-secured put: you sell a put for $1.20 with a $50 strike, one contract. Your credit per share is $1.20 minus fees. But your capital tied up is $50 times 100 times 1, or $5,000. That $5,000 number matters. Two trades can both collect $1.20 in premium, but if one ties up $5,000 and the other ties up $3,000, their real return on capital is nowhere close to equal. Putting the collateral next to the return on that collateral is the fastest way to see the gap.
By the end of this step, you should have three things written down: your position labeled correctly, your premium signed as a debit or a credit, and, if you are a seller, your capital tied up for the trade.
Step 2: find the breakeven that matches your position
Breakeven is the stock price where your trade makes exactly zero dollars at expiration. Expiration is the date the option contract ends. This price doesn’t include taxes or any what-ifs. It’s just the one number where your profit and loss line crosses zero.
The formula you use depends on the label you wrote down in Step 1. There are four formulas, one for each position type. All of them give you a per-share price.
- Long call (you paid to have the right to buy stock): breakeven = strike + premium paid
- Long put (you paid to have the right to sell stock): breakeven = strike - premium paid
- Short call (you got paid to promise to sell stock): breakeven = strike + premium received
- Short put (you got paid to promise to buy stock): breakeven = strike - premium received
The strike is the set price written into the contract. The premium is the price of the option itself, what you paid or got paid to enter the trade.
Notice the pattern. Buyers add or subtract based on which direction protects them. Sellers use the same math, but the premium works in their favor instead of against them. That’s why a short call and a long call use the same operation. Only the meaning of the premium flips.
Once you have your number, checking it is simple. Compare the stock’s last price at expiration to your breakeven price. Nothing else matters here. The contract multiplier is the fact that one options contract controls 100 shares. It only changes how many total dollars you make or lose. It never changes the breakeven price itself. That price always stays a per-share number.
Running a wheel? Breakeven means something specific. The wheel is a strategy where you sell puts, and if you get assigned the stock, you sell calls against it. For a cash-secured put, your breakeven is the real price you’re paying for the stock if you get assigned the shares. That’s strike minus premium received. This number matters because it’s your true entry price, not just the strike price alone. It is also why breakeven means something different once you are the seller.
For a covered call, split the outcome into two separate breakevens:
- Stock breakeven compares the current price to your actual share cost basis. You calculated this number in Step 1.
- Called-away breakeven looks at your full outcome if the shares get sold at the strike. This includes the premium you collected plus any gain in the stock price up to the strike.
Worked example, using the numbers from Step 1.
Take the cash-secured put from Example B. The strike is $50 and the premium received is $1.20. Breakeven equals $50 minus $1.20, or $48.80. If the stock closes at expiration above $48.80, you come out ahead. Below that, you lose money.
Now compare that to a long call at the same $50 strike. Say the premium paid is also $1.20. Breakeven equals $50 plus $1.20, or $51.20. Same strike, same premium amount, but the breakeven sits on opposite sides of the strike. That gap shows how differently these two trades behave.
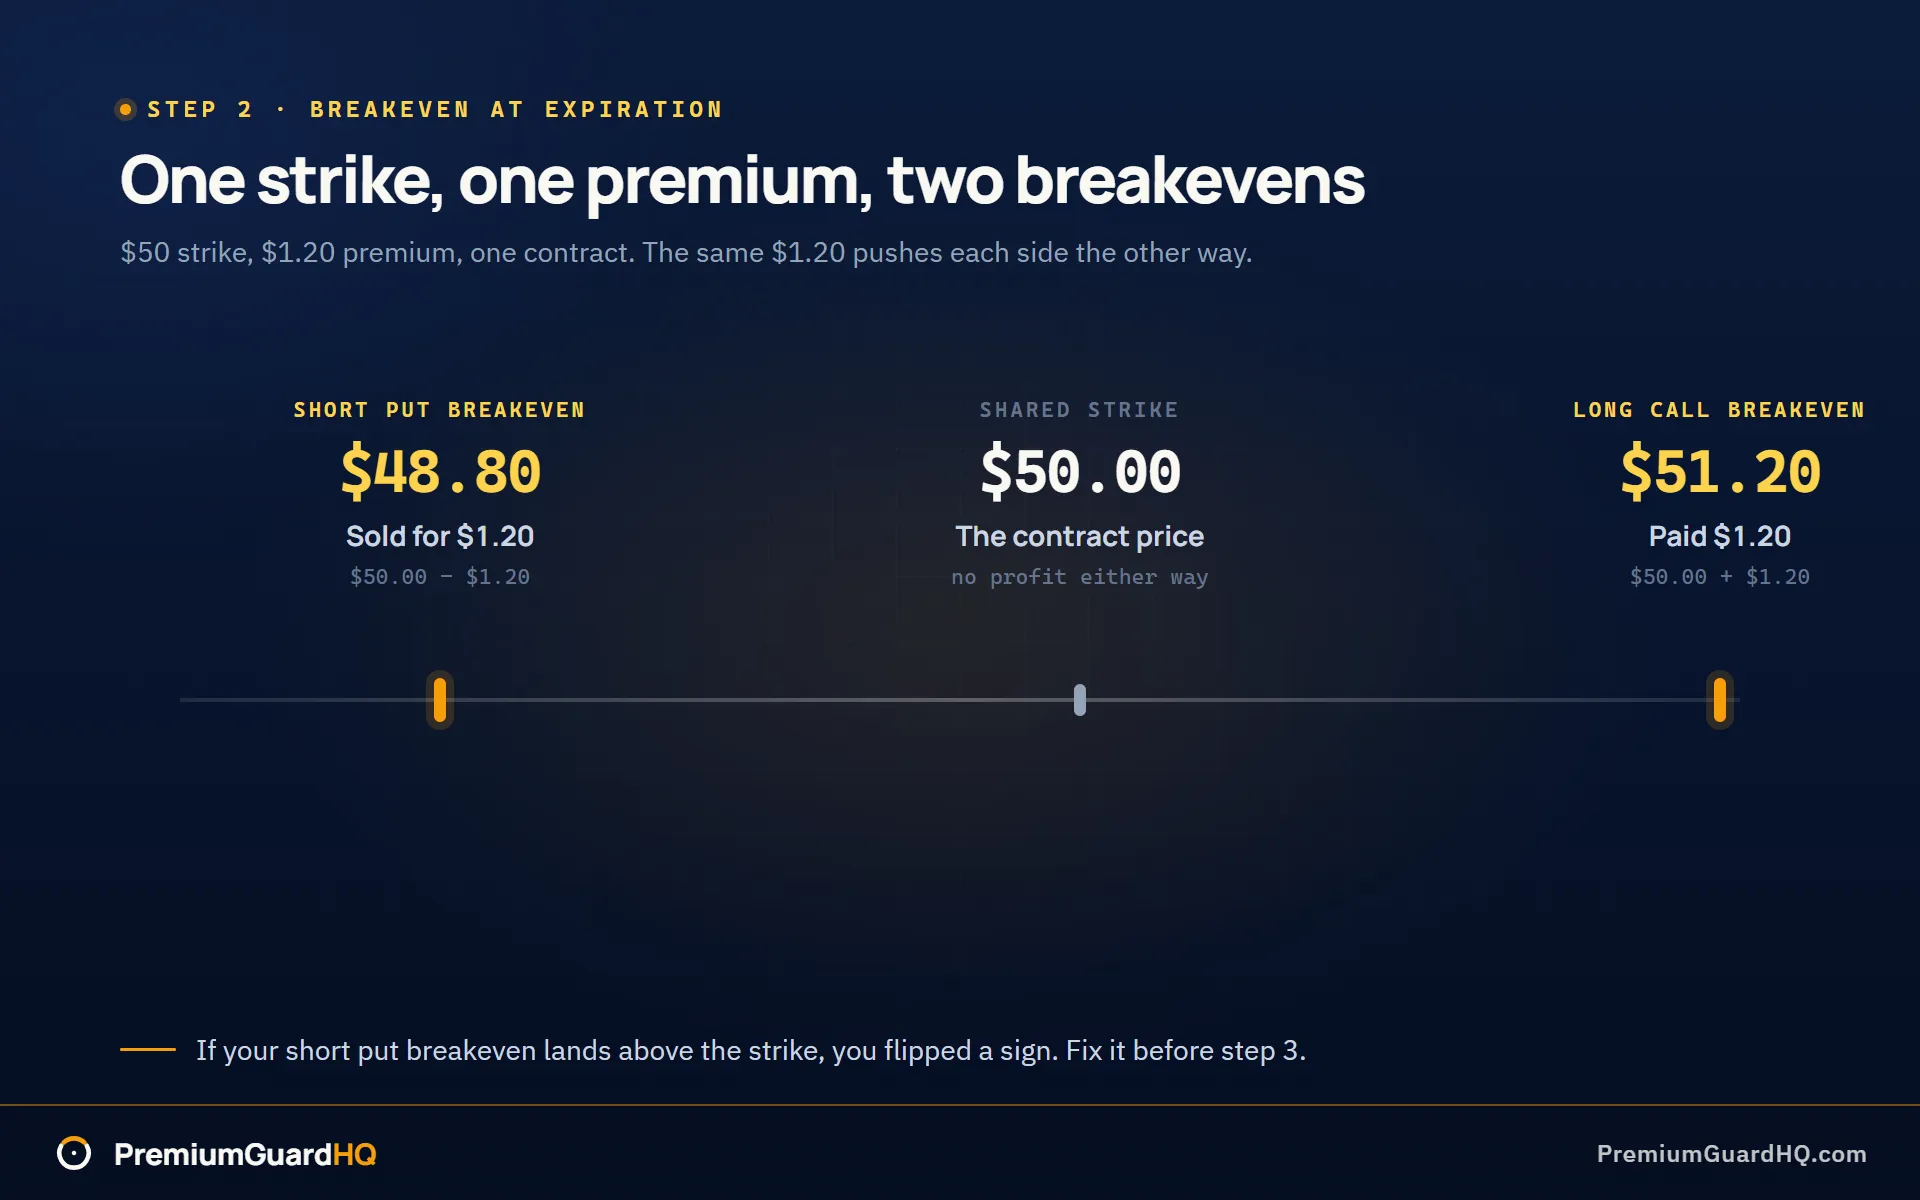
Run a quick sanity check before moving on. Ask whether your breakeven makes sense for your position. A short put’s breakeven should sit below the strike. A long call’s breakeven should sit above the strike. If yours comes out backwards, you flipped a plus or minus sign somewhere, or you mixed up what you paid with what you received. Fix that now. Every number in the next two steps builds on this one.
You should now have a single breakeven price written down in dollars per share, ready to compare against the stock price at expiration.
Step 3: compute profit and loss at expiration in dollars
Now for the number you actually care about: how many dollars did you make or lose. This step turns your breakeven from Step 2 into a real dollar figure.
Start with intrinsic value. Intrinsic value is what an option is actually worth at expiration, based only on the stock price versus the strike price. The strike price is the set price written into the option contract. Intrinsic value is the same number for both the buyer and the seller.
- Call intrinsic value = the bigger number between zero and the stock price minus the strike.
- Put intrinsic value = the bigger number between zero and the strike minus the stock price.
If the math comes out negative, use zero instead. An option can never be worth less than nothing.
Turn intrinsic value into profit or loss, per share. This is where your label from Step 1 matters again. A long option means you bought it. A short option means you sold it.
- Long option: profit per share = intrinsic value minus premium paid. Premium is the price you paid for the option.
- Short option: profit per share = premium received minus intrinsic value.
Buyers need the stock to move far enough to beat what they paid. Sellers keep the premium as profit, minus whatever the option ended up worth.
Now turn that per-share number into real dollars. Multiply by 100 shares per contract, then by your number of contracts, then subtract your fees.
Total P/L = (profit per share) x 100 x contracts - transaction costsThat single number is your answer for this step. Fees matter more than most traders think. On a handful of contracts trading for a dollar or two, a few dollars of commissions and exchange fees can eat five or ten percent of your profit.
Assignment and exercise change what happens next, not this formula. Exercise means a long option holder cashes in their right to buy or sell stock. Assignment means a short option seller gets forced into that same trade. If your long option gets exercised, you now own or sold stock. That stock position has its own profit or loss going forward. The option math above assumes you sell the option itself at its expiration value, not that you hold the resulting stock. If your short option gets assigned, you now have a stock position too. The option leg profit or loss is locked in exactly as calculated above. What happens next depends entirely on how you handle the shares.
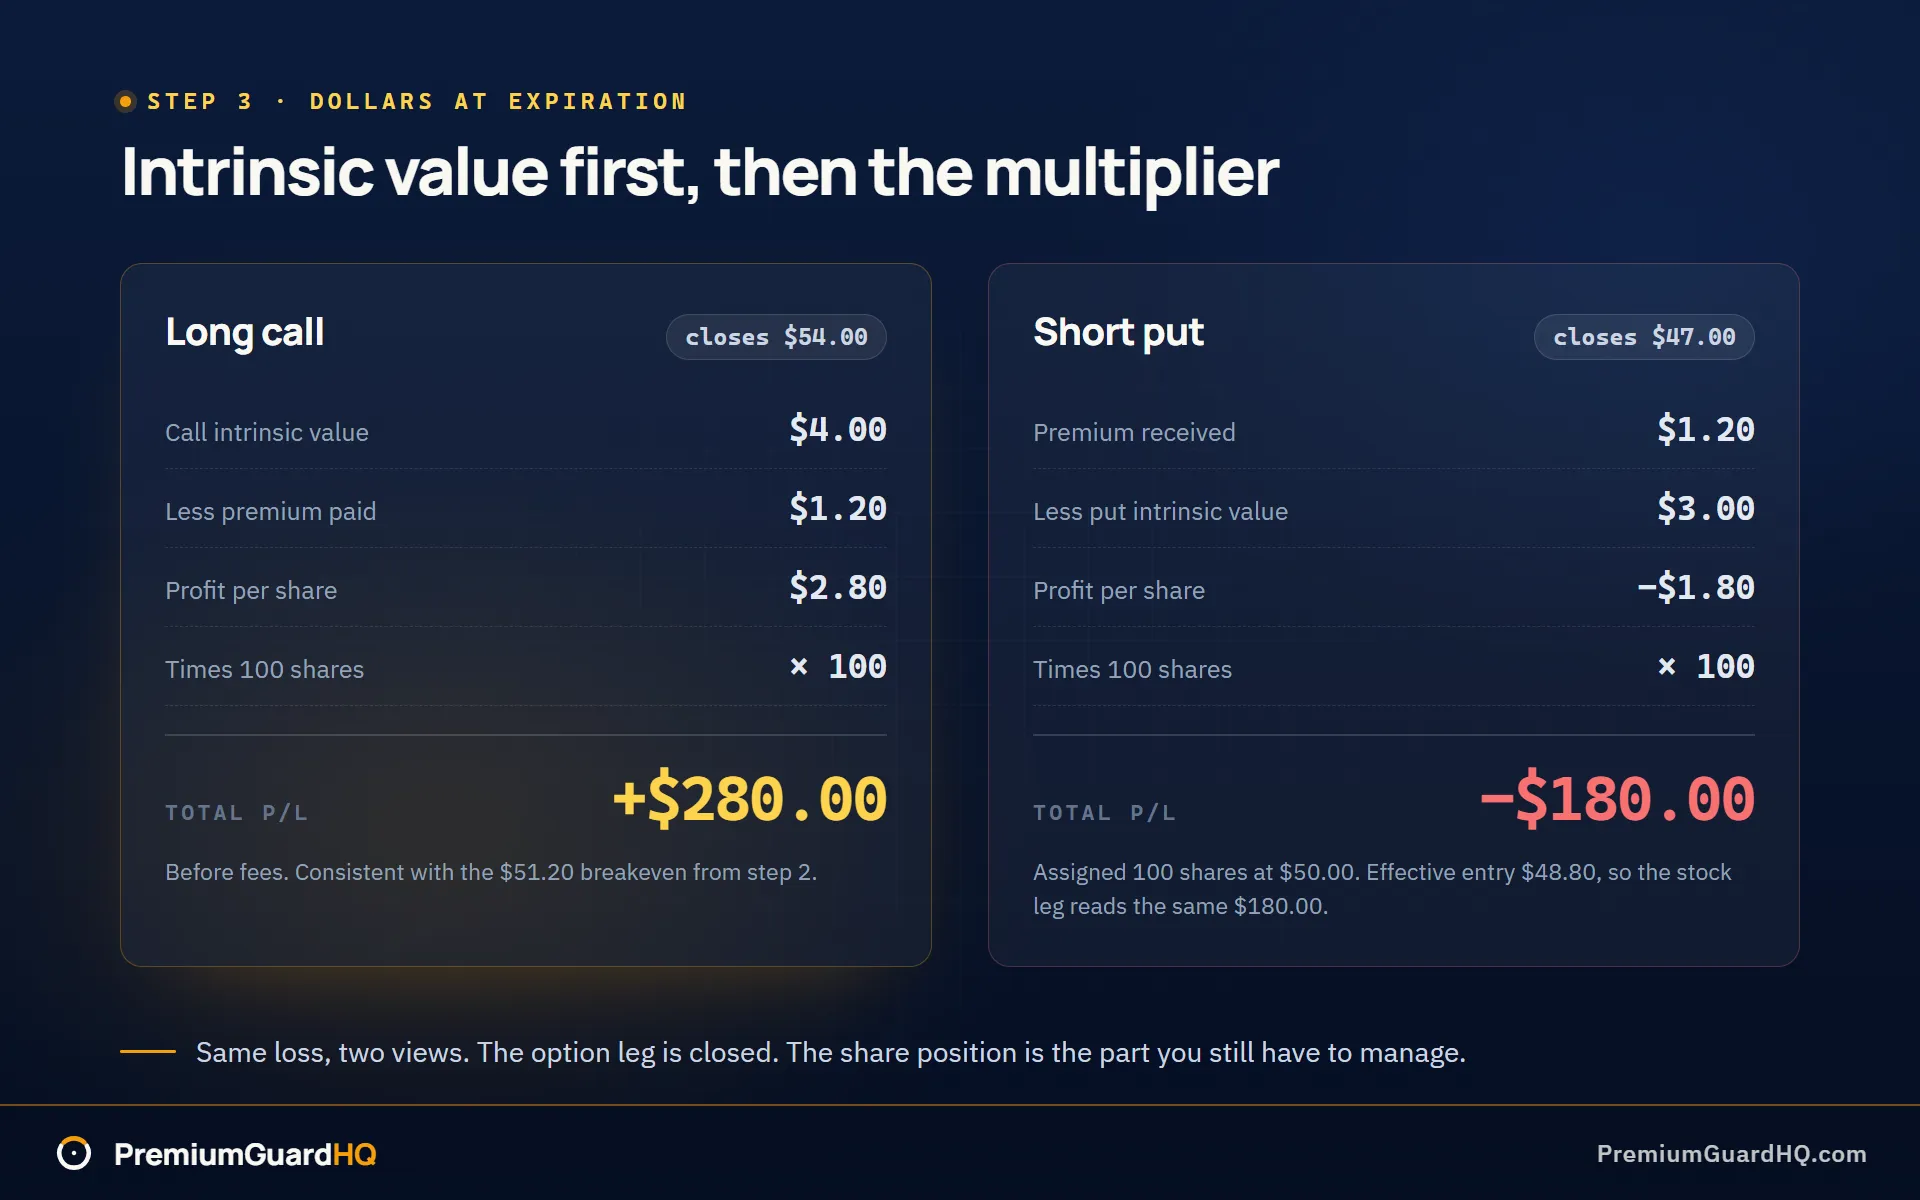
Example 1, a long call. You paid $1.20 in premium for a call with a $50 strike, one contract. The stock closes at $54. Call intrinsic value equals $54 minus $50, or $4.00. Profit per share equals $4.00 minus $1.20, or $2.80. Total profit equals $2.80 times 100, or $280, minus fees. This matches the breakeven of $51.20 you found in Step 2.
Example 2, a short put. You sold a put for $1.20 with a $50 strike, one contract, same setup as Example B in Step 1.
- Stock closes above $50: put intrinsic value is zero. Profit per share equals $1.20 minus zero, or $1.20. Total profit equals $120 minus fees. You keep the whole premium. No assignment happens, so you get no stock position.
- Stock closes below $50, say at $47: you get assigned 100 shares at $50. Put intrinsic value equals $50 minus $47, or $3.00. Profit per share equals $1.20 minus $3.00, or negative $1.80. Total loss equals $180 plus fees, on the option leg alone. But look at your real entry price. Effective entry equals strike minus premium, or $50 minus $1.20, which is $48.80. That matches the breakeven you found in Step 2. Your unrealized stock profit or loss the moment you get assigned equals the stock price minus your effective entry, times 100 shares. That’s $47 minus $48.80, times 100, or negative $180. Same number, viewed two different ways.
The same split applies in reverse for a covered call that gets called away, meaning your shares get sold at the strike price. The option leg profit is fixed and easy to calculate the moment the stock closes above your strike. But your real outcome also depends on what you originally paid for the shares. A tool that separates the option leg from the stock leg saves you from reconciling the two by hand.
You should now have one dollar figure for your option position at expiration, fees included, plus a clear answer to whether assignment or exercise hands you a stock position to manage next.
Step 4: compute profit and loss before expiration, then annualize it
Most guides stop at Step 3. That works if you plan to hold every trade until expiration, the date the contract ends. But you probably won’t. You might close early, or just want to know what a position is worth right now. This step shows you how, then turns that answer into a number you can use to compare any two trades, no matter their size or length.
“Profit before expiration” means what you’d pocket if you closed the trade today. Traders call this mark-to-market profit and loss. It uses a realistic price you could actually get filled at right now, not the price at expiration.
Method 1: use the option’s current market price
This is the default method. Try this one first. Look up the option’s current price. Traders call this the mark. Then use one of these two formulas, based on the label you wrote down in Step 1.
- Long option: profit now = (current sell price minus your buy price) times 100 times contracts, minus fees.
- Short option: profit now = (your sell price minus current buy-to-close price) times 100 times contracts, minus fees.
Use a realistic fill price, not the best-case number. If the option trades often and the gap between the bid and ask prices is small, use the mid price. That’s the price halfway between the bid and the ask. If the option barely trades and that gap is wide, assume a worse fill. Use a price closer to the bid if you’re selling, or closer to the ask if you’re buying.
Method 2: estimate with Greeks when the price isn’t obvious
Sometimes you can’t get a clean quote. Maybe the option is illiquid, meaning it trades rarely. When that happens, estimate the new option price using Greeks. Greeks are numbers that describe how an option’s price reacts to changes in the stock, time, and other factors.
Start with delta. Delta tells you how much the option price moves when the stock price moves one dollar.
Price change from delta ~= Delta x change in stock priceNext, subtract the effect of theta. Theta is the amount of value an option loses each day, just from time passing.
Subtract: Theta x days heldAdd these two refinements only if you want more precision:
- Gamma curvature: add 0.5 x Gamma x (change in stock price squared). Gamma measures how much delta itself shifts as the stock moves.
- Implied volatility move: add Vega x the change in implied volatility, measured in percentage points. Vega measures how much the option’s price reacts to a change in expected future volatility. This step models what traders call IV crush, a sudden drop in implied volatility that shrinks option prices fast.
Once you have your estimated new option price, plug it into the same long or short formulas from Method 1. That gives you your dollar profit or loss.
Convert your profit into return on capital
Dollars alone don’t tell you much. A $200 profit means something different on $5,000 tied up than it does on $50,000. Return on capital, or ROC, fixes that problem. It answers one question: how much did you make compared to how much you had locked up?
For a cash-secured put, a trade where you set aside cash to buy shares if assigned:
Capital base = strike x 100 x contracts
ROC = profit / capital base
For a covered call, a trade where you sell someone the right to buy shares you already own:
Capital base = share basis x shares
ROC = (option profit plus stock profit if called away) / capital base
If you trade on margin, meaning you’re borrowing buying power from your broker, pick one definition of capital base. You can use your broker’s buying power reduction, or you can use the full value of the position. Both work. Just don’t switch definitions between trades. If you do, your comparisons stop meaning anything.
Annualize it so you can compare trades fairly
A trade that returns 2% in five days is very different from one that returns 2% in sixty days. Annualizing puts every trade on the same clock, so you can compare them fairly.
Annualized ROC ~= ROC x (365 / days in trade)This number lets you stack a one-week trade against a two-month trade and see which one actually works harder for your money. If you want more precision later, you can compound this figure instead of multiplying it in a straight line. For now, keep the main workflow simple.
Check your work with a gut check. The same dollar profit on less tied-up capital should always produce a higher ROC. And if your profit stays the same but you hold the trade longer, your annualized ROC should drop. If either check fails, look again at your capital base and your day count before you trust the number.
By the end of this step, you should have three numbers in hand: your profit or loss if you closed the trade today, your return on capital based on what the trade tied up, and an annualized version of that return you can use to compare this trade against any other, no matter its size or duration.
What you should see when the math is done
After step 4, you should have a short summary with five lines. Anyone could read it and understand your trade in ten seconds.
- The label. Long or short, call or put, number of contracts, strike price, and expiration date.
- The true cost basis. Premium paid or received, plus total fees. Premium is the price of the option.
- Breakeven at expiration. The stock price where you neither win nor lose money, in dollars per share.
- Profit or loss at expiration. Total dollars at a stock price you pick.
- Profit or loss right now, plus annualized ROC. ROC stands for return on capital. It means how much money you made compared to how much cash you had tied up.
Before you trust these numbers, run three quick checks.
Check your multiplier. One options contract equals 100 shares. If your total dollars are off by exactly 100 times the right amount, you mixed up a per-share number with a per-contract number in step 3 or step 4.
Check your signs. A short option is one you sold. It should lose money when the stock moves against you, and gain money as the option gets cheaper to buy back. If your short put shows a bigger loss while the option’s price is dropping, you flipped a plus or minus sign in step 1 or step 3.
Check your ROC direction. Keep your capital tied up the same. A bigger profit must always produce a bigger ROC. If it doesn’t, your capital number is inconsistent between trades.
Once all three checks pass, run the same trade through a calculator. Use it to confirm your own math, not to tell you what to trade next.
Frequently asked questions
Why did my option lose money even though the stock moved the right way?
An option’s price is made of two things: intrinsic value and time value. Intrinsic value is the real, built-in value based on the stock price versus the strike. Time value covers everything else, including implied volatility, or IV. IV measures how much movement the market expects. If IV drops sharply after you buy, a move called IV crush, your option can lose value even while the stock goes your way. To put a dollar figure on it, multiply Vega, which measures how much price reacts to IV, by the change in IV. Near expiration, theta can also outweigh a small favorable move. Theta is the daily value an option loses just from time passing.
How do I calculate profit for a covered call in one number?
Add your option profit to your stock profit, capped at the strike. Total outcome equals the premium you kept, plus your stock gain or loss up to the call strike. If your shares get called away, meaning they’re sold at the strike, your realized stock profit stops there even if the stock kept climbing. For the return on capital piece, divide that total by your share cost basis. See Step 4 above for the full breakeven and ROC math.
How do I calculate profit for a cash-secured put if I get assigned?
Split it into two pieces. The option leg is simple: premium received minus intrinsic value at expiration. Intrinsic value is what the put is worth based on stock price versus strike. Your effective stock entry price is strike minus premium received, minus fees. That’s your real cost basis going forward, not the strike price alone. Your total profit or loss after assignment depends on the stock’s price from there, plus any covered call premium you collect later in the wheel cycle. See Step 3 above for a full worked example.
What changes if I close before expiration instead of holding to expiry?
You switch from intrinsic value math to mark-to-market math. Mark-to-market means pricing your position using what you could actually sell it for or buy it back for right now, not what it’s worth at expiration. Use a realistic fill, the mid price for liquid options, or a worse price for options that barely trade. Your breakeven also changes meaning. It becomes the price where you could close the trade for exactly zero profit, based on the option’s current market price rather than intrinsic value alone.
How do I calculate profit for spreads or iron condors?
A spread means combining multiple option legs with different strikes. An iron condor combines four legs. At expiration, add up the intrinsic value of every leg, then subtract your net debit or add your net credit. A net debit is what you paid overall. A net credit is what you collected overall. Before expiration, you have to mark each leg to market separately, then net them together. For return on capital, use the strategy’s defined-risk amount, meaning your maximum possible loss, or the collateral your broker actually holds.
Do taxes change my options profit calculation?
Taxes reduce your net profit, but they don’t change the pre-tax math in this guide. What changes is more subtle: tax treatment varies by product type and holding period, and assignment or exercise can reset your stock’s cost basis for tax purposes. That’s a separate number from the trading cost basis you calculated in Step 1. Keep clean records for each closed cycle, and talk to a tax professional about your specific situation.