
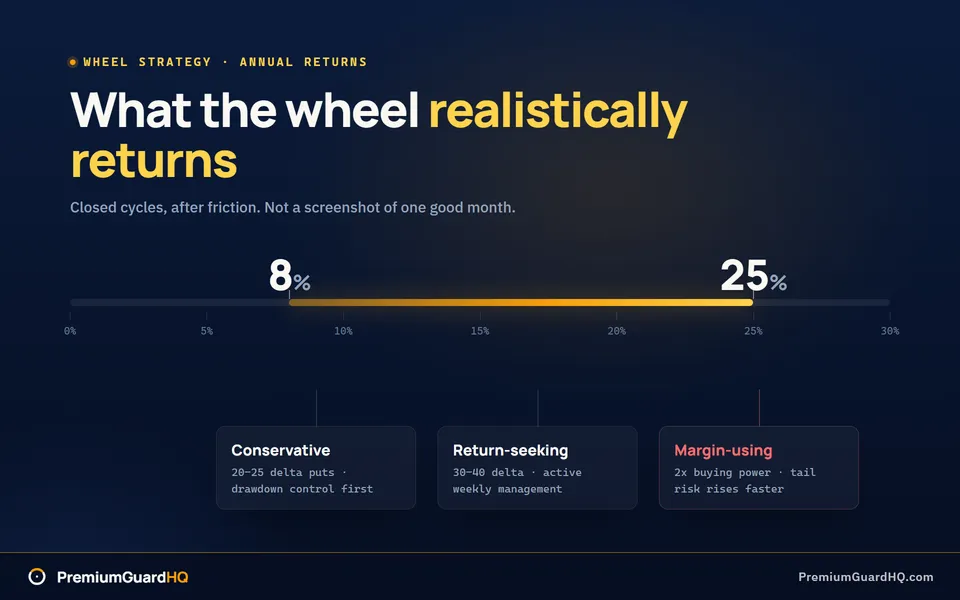
Realistic wheel strategy returns look like income, but premium remains unearned until the cycle closes. Many operators mistake cash flow for profit, only to withdraw capital that was never truly earned.
Premium collected, account equity, and withdrawable income are distinct metrics that are often confused. This guide shows you how to calculate performance correctly and set expectations against buy-and-hold benchmarks. We rely on math and operating rules to keep the strategy honest. No signals, no hype.
Wheel strategy returns: premium yield vs. total return
Wheel strategy returns represent the total performance generated from selling cash-secured puts and covered calls, measured as premium collected plus any stock gains or losses, after costs. A return is only fully knowable when a cycle closes because assignment or call-away can turn income into equity drawdown or capped upside.
Serious operators distinguish between premium yield and total return. Premium yield reflects the cash credits collected from selling options. Total return accounts for those credits alongside fluctuations in the underlying stock value. Relying on premium-only metrics often masks true performance.
The core accounting rule is that premium is unearned until the wheel closes. Until you return to cash, any collected premium is a temporary credit. This credit can be offset by share price depreciation. Realized profit only exists once the cycle concludes.
How to calculate wheel strategy returns
To measure performance like a business operator, you must use the wheel cycle as your base unit. A cycle begins with the initial cash-secured put (CSP) and follows through every roll or assignment. It only concludes when shares are called away or the position is closed for cash. Tracking wheel strategy returns by calendar month alone masks the true performance of these multi-stage positions. For the full mechanics behind that cycle, see the options wheel strategy explained.
Operators use a three-number view to keep the math honest:
- Premium P/L: Net credits from all puts and calls minus any debits paid to close or roll legs.
- Equity P/L: The change in share value, realized upon exit but tracked as unrealized during assignment.
- Net income: Premium P/L + Equity P/L minus commissions, fees, and taxes.
Measure efficiency through two lenses. Return on capital (ROC) is net profit divided by the collateral reserved for that specific trade. Return on equity (ROE) is net profit divided by total account equity. ROE is the more accurate reflection of actual wealth growth because it accounts for idle cash and margin usage.
Avoid the temptation to annualize a single winning month. Multiplying a 3% monthly return by 12 is a common fiction that ignores non-linear drawdowns and capital lock-up during assignment. It also fails to account for shifts in implied volatility that may dry up in future cycles. Realized annual returns come from consistent execution, not a single outlier month.
The broker screen is your primary obstacle to accuracy. Brokerages often adjust cost basis for wash sales or premiums, making it difficult to see the original trade’s health. You must maintain a per-cycle ledger that records every credit against the original strike price independently. Without this, you risk withdrawing premium that is actually just a return of your own eroding capital.
PremiumGuardHQ provides the instrumentation to solve this bookkeeping problem. The platform auto-detects cycles, reconciles cost basis from raw fills, and computes a safe withdrawal amount from closed-cycle profits. This way you only pay yourself from earned income while keeping your capital engine intact.
Why wheel strategy returns cluster around 20%
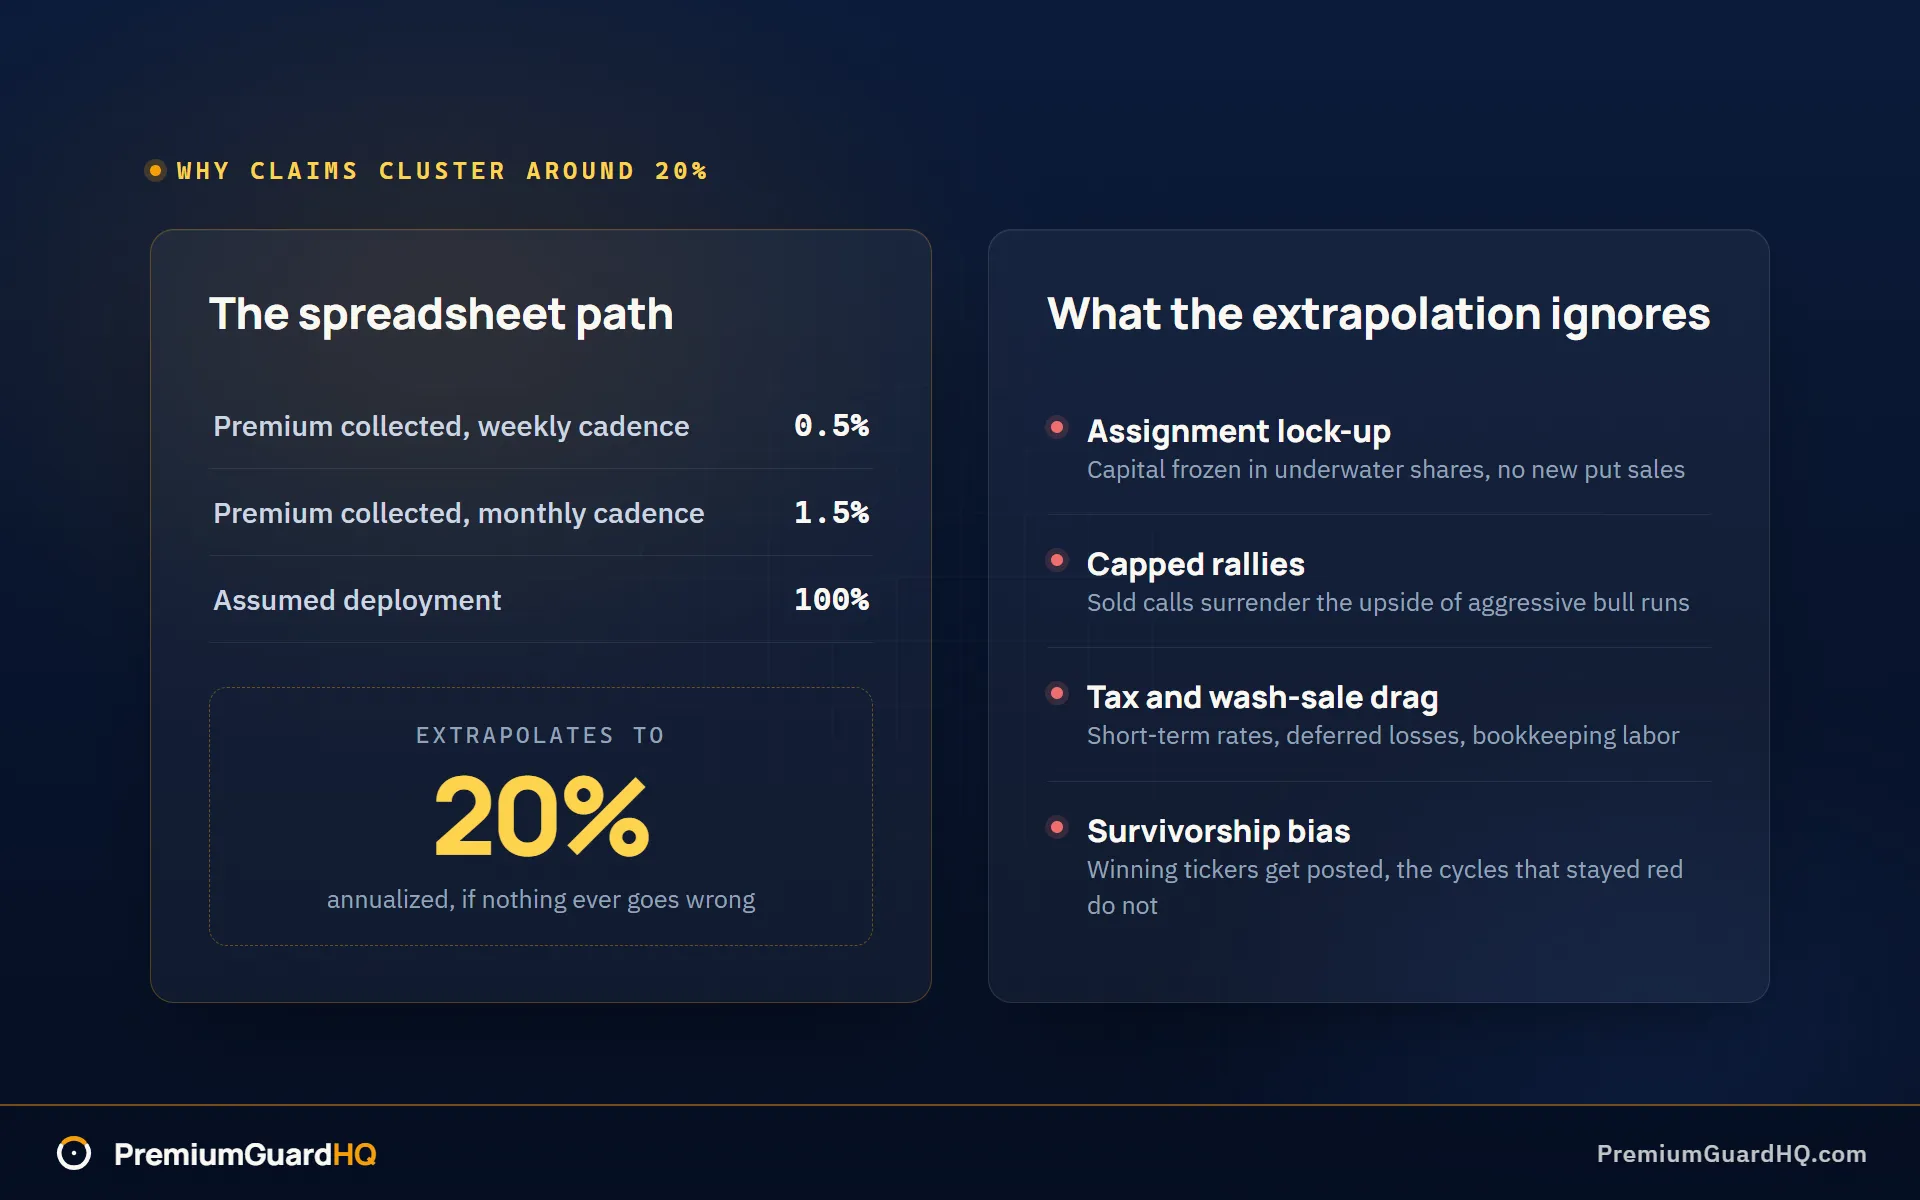
Public examples often extrapolate short-term wins into annual figures. A trader collecting 0.5% weekly or 1.5% monthly sees a spreadsheet path to 20% annualized. This math assumes perfect conditions and 100% deployment, which rarely survives a full market cycle.
These 20% claims typically ignore variables that drag on net performance:
- Assignment months where capital is locked in underwater equity, preventing new put sales.
- Bull-market opportunity cost when sold calls cap upside during aggressive rallies.
- Short-term tax treatment, wash-sale deferrals, and the manual labor of recordkeeping.
- Survivorship bias: winning tickers get the spotlight while the cycles that stayed red for 18 months stay hidden.
Treat any single percentage as a range rather than a fixed goal. Realized returns fluctuate based on four specific variables: underlying selection, strike aggressiveness, position sizing, and the specific market year you are living through. Numbers without context anchor expectations to best-case scenarios that ignore the reality of a drawdown.
Premium yield is not free: the return drivers that actually move the needle
Yield is a direct function of risk. You are not extracting money from the market; you are being compensated for accepting specific risks. Realized wheel strategy returns are dictated by four operational levers.
- Implied volatility (IV): This sets the premium floor. High IV is the market pricing expected turbulence, not a gift. A 5% monthly yield often requires accepting a 15% underlying price swing, effectively trading stability for premium.
- DTE and management frequency: Shorter cycles increase theoretical annualized yields but add friction. Executing 12 monthly cycles versus 52 weekly cycles changes your tax drag and commission overhead significantly.
- Underlying behavior: This is the primary determinant of success. The wheel thrives in sideways markets. Aggressive uptrends cap your gains at the strike price, while sharp downtrends result in assignment on underwater equity that can freeze capital for months.
- Assignment handling rules: Disciplined rules prevent permanent bag-holding. Without a process for when to roll versus when to accept shares, your income stream remains fragile.
Operator takeaway: if your process does not explicitly handle drawdowns and assignment, your premium stream is cosmetic.

Strike selection: far out of the money vs. at the money
Strike selection is a direct trade-off. Closer-to-the-money (CTM) strikes pay higher premiums because they carry higher delta, but they increase the probability of owning the stock or losing shares. Your choice dictates both your return profile and your active management workload.
Far out-of-the-money (OTM) sellers prioritize lower assignment frequency and smoother equity curves at the expense of yield. In contrast, CTM sellers capture higher premium per unit of time but face frequent whipsaw and require disciplined exit management.
The narrative of higher returns with tighter strikes is a relocation of risk. You accept higher delta exposure and more frequent capital churn. No wheel strategy reduces risk automatically; it simply exchanges the risk of rare tail events for the risk of constant price sensitivity.
PremiumGuard supports serious operators who choose tighter strike ranges and want their math visible. It uses per-cycle ledgers and drift alerts to help traders avoid accidental equity erosion. Headline goals like “Make more money. Take less risk.” are goalposts requiring instrumentation and discipline, not default outcomes.
Margin and how people get to 50% plus years (and why it can break accounts)
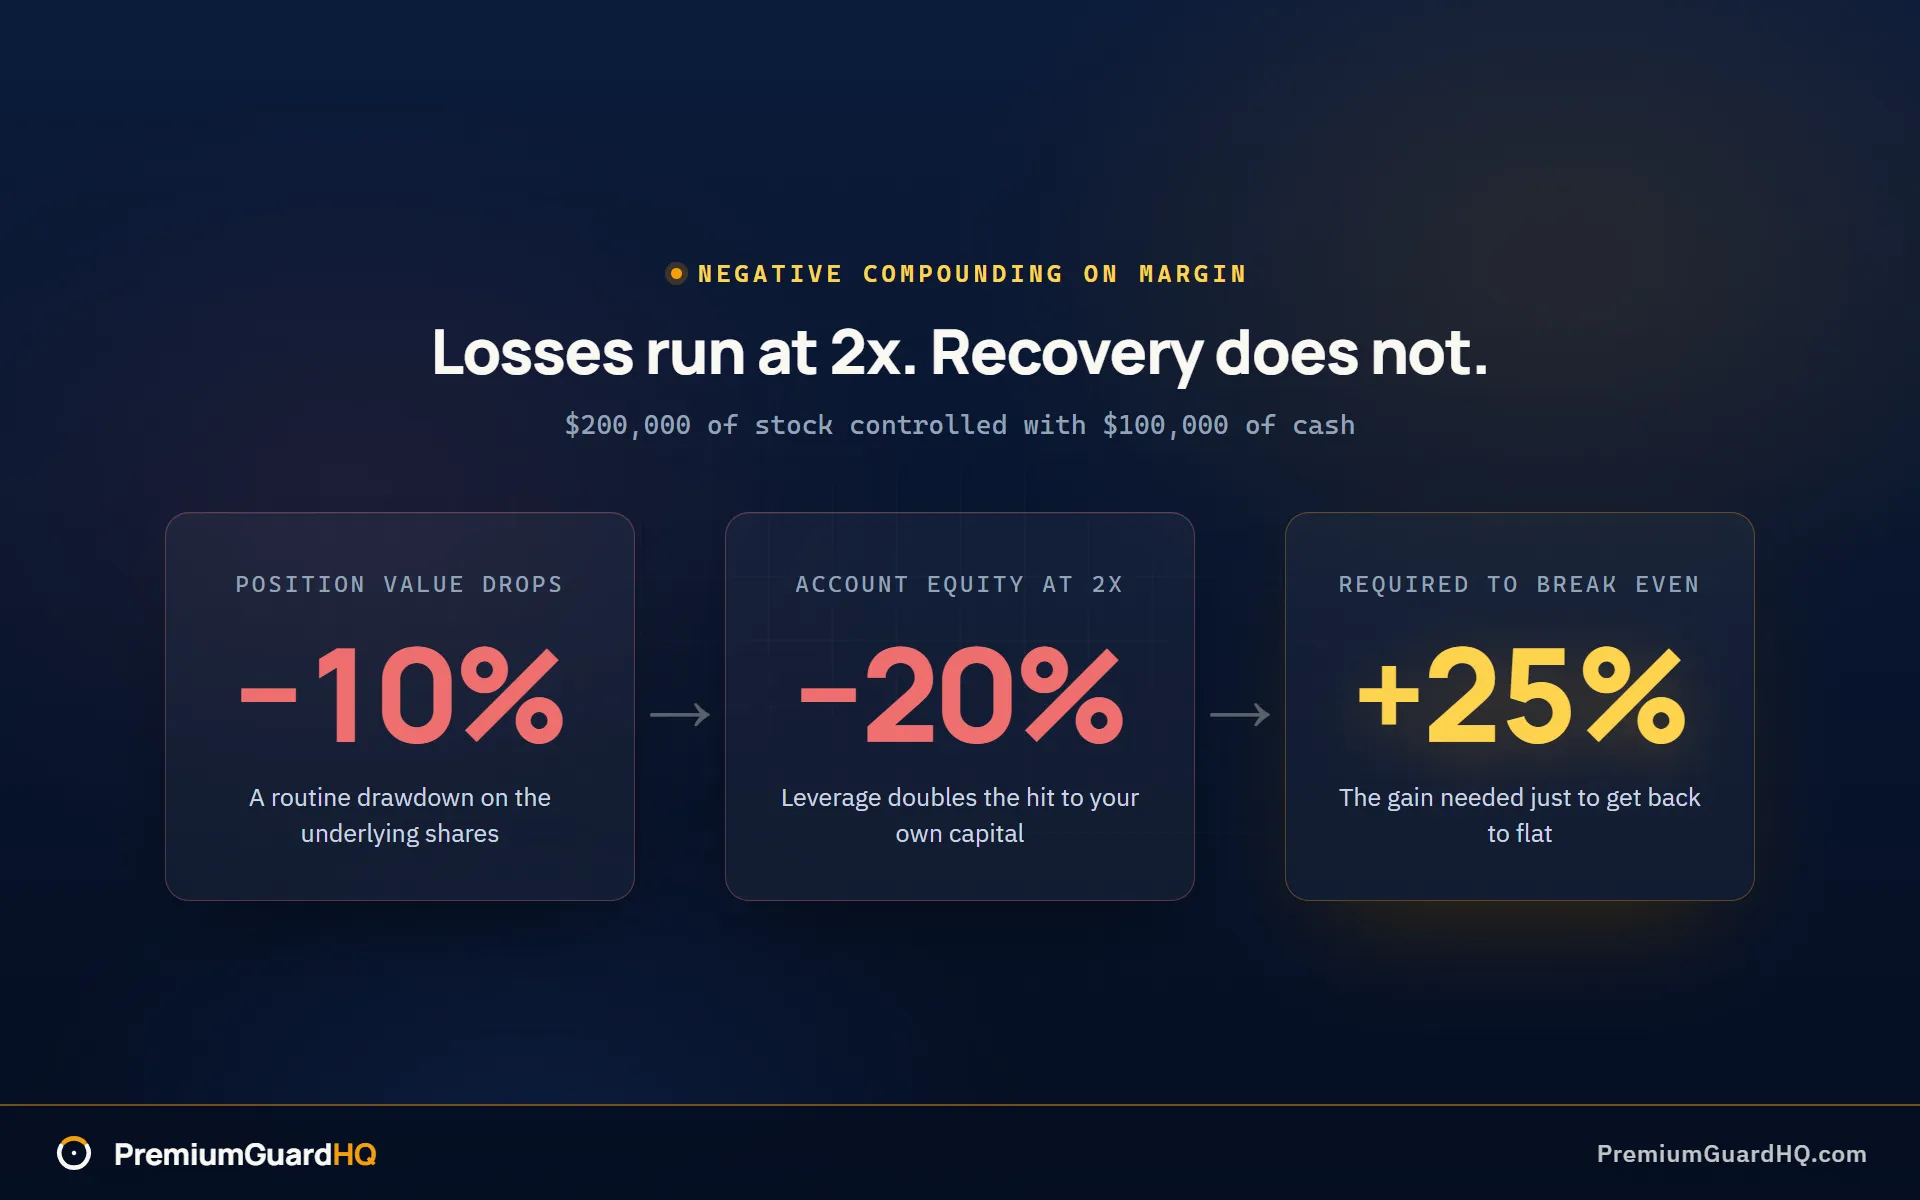
Margin decouples notional exposure from your cash balance. While a cash-secured put requires 100% collateral, most standard margin accounts allow up to 2x buying power. This allows an operator to control $200,000 of stock with $100,000 of cash, doubling return on equity (ROE) from premiums.
Using margin this way drives the wheel strategy returns seen in 50% plus annual profiles. However, margin changes the strategy from a long-equity play into a credit-risk play with three failure modes.
- Forced liquidation risk: Falling equity and rising maintenance requirements can force brokers to liquidate positions at the market bottom.
- Correlation risk: Seemingly independent positions move together in broad sell-offs, evaporating buying power needed to manage assignments.
- Negative compounding: A 10% drop on a 2x levered account causes a 20% loss of equity, requiring a 25% gain to break even.
Margin advocates counter each failure mode with specific practices:
- Liquidation buffers: A margin call rarely liquidates an entire account. Holding a 10% to 20% buying-power buffer usually limits forced selling to a small slice of one position, and margin sellers argue the extra yield more than covers those occasional trims.
- Diversification across industries: Spreading positions across unrelated sectors and favoring lower-beta names you would be comfortable holding reduces the odds that every position demands capital at once.
- Cost-basis discipline: Negative compounding only becomes real when you sell below your cost basis. Per-cycle cost-basis tracking, the job PremiumGuard is built for, helps operators avoid locking in that loss.
If you cannot survive a sharp drawdown without changing rules mid-stream, margin will expose that gap. It is a stress test you will fail.
The friction stack: fees, slippage, and why broker numbers mislead
Every trade carries costs beyond the ticker price. Commissions and per-contract fees might seem negligible, but frequent rolling and short DTE strategies turn these into a permanent drag on wheel strategy returns. Slippage from wide bid-ask spreads on illiquid strikes acts as a quiet tax, stripping away 1 to 3 percent of your potential premium yield.
Taxes and wash sales create the widest gap between perceived and actual returns. Most wheel profits are taxed as short-term capital gains at ordinary income rates. Traders who repeatedly trade the same ticker within 30 days trigger wash sale rules. This defers losses and complicates cost basis math beyond what a standard spreadsheet can handle.
Standard broker screens show data fragments rather than a reconciled business ledger, often adjusting cost basis for wash sales in ways that mask your true performance. Professional tracking requires three distinct metrics:
- Premium P/L
- Equity P/L
- Net Income
PremiumGuard reconciles every fill into closed cycles so the Safe Withdrawal Engine can focus only on realized results. This prevents withdrawing paper returns that disappear when accounting reality hits.
Worked example: one wheel cycle, two ways to report returns
Stock trades at $100. Sell one cash-secured put, 30 to 45 DTE, at the $98 strike for a $2.00 credit ($200). Your broker locks $9,800 in collateral.
Outcome A: put expires worthless
The stock stays above $98. You keep the $200 premium as realized profit. Your Return on Capital (ROC) for this specific cycle is 2.04% ($200 divided by $9,800).
Avoid annualizing this by multiplying 2.04% by the cycles per year. This math assumes 100% deployment and constant implied volatility. In real markets, capital sits idle or volatility shifts, making simple multiplication inaccurate.
Outcome B: assignment and recovery
The stock drops to $95. You are assigned 100 shares at $98. Your effective entry is $96 ($98 strike minus $2.00 premium). You then sell a $98 strike covered call for $1.50 ($150).
If the stock recovers and shares are called away at $98, the closed cycle accounting is:
| Metric | Value |
|---|---|
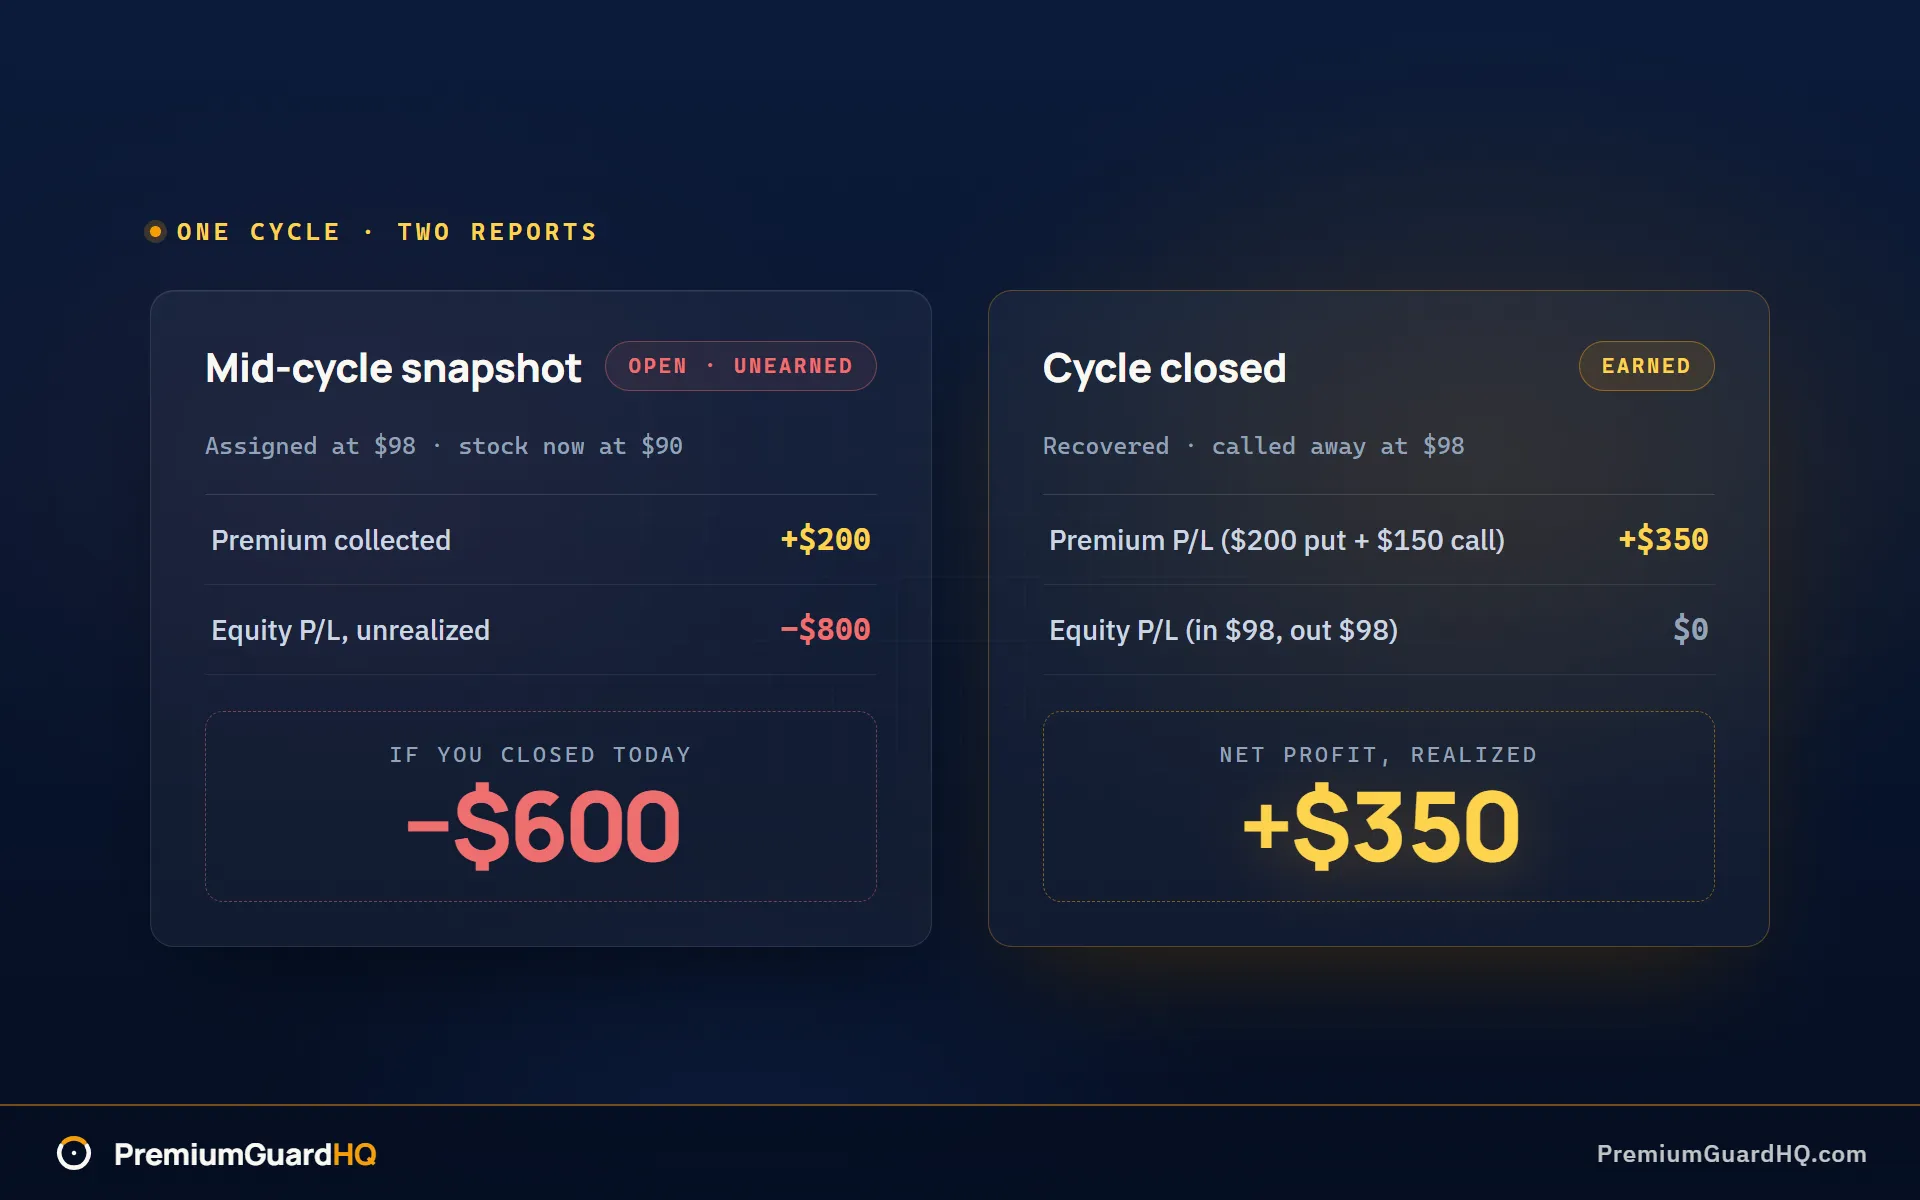
| Realized Premium P/L | $350 ($200 put + $150 call) |
| Realized Equity P/L | $0 (Assigned $98, called at $98) |
| Net Profit | $350 |
Contrast this with the holding period. If the stock drops to $90 before recovering, you have $200 in realized premium but $800 in unrealized equity loss. Withdrawing that premium before the cycle closes silently erodes your capital base.
This is why “income” and “return” are different until the cycle is closed.
Honest tradeoffs: what can improve wheel returns and what it breaks
Every lever pulled to increase yield creates a corresponding failure mode. Serious operators treat these as business tradeoffs rather than magic formulas. If you want higher returns, you pay in risk, complexity, or time.
- Closer strikes: Selling a 40-delta put generates higher premium than a 20-delta put but doubles assignment frequency. This increases transaction costs and churn while capping upside more frequently.
- Margin: Using margin can double ROE in stable markets. It introduces forced-selling risk where sharp drawdowns trigger margin calls, liquidating positions at the bottom.
- Active management: Frequent rolling can improve outcomes in volatile markets but creates execution risk. High management frequency increases the likelihood of human error or decision fatigue during fast-moving price action.
- Index underlyings: Index ETFs reduce the risk of catastrophic overnight gaps but offer lower premiums. Single names provide higher yields to compensate for idiosyncratic risk and potential permanent capital loss.
- Smaller sizing: Spreading capital across 15 or more positions stabilizes the equity curve. This increases the management tax where a single missed expiration can erase the diversification benefit.
These are tradeoffs requiring measurement, not guarantees. PremiumGuard makes drift, concentration, and withdrawable income visible before damage compounds. The trader makes the decision; the platform makes the math visible.
Setting realistic wheel strategy returns: operator profiles
Conservative operator
This profile values survivability over headline CAGR. By selling low-delta puts (20 to 25 delta), you target modest yield with minimal forced decisions. Success is measured by consistency and drawdown control rather than chasing maximum premium.
Return-seeking operator
You sell strikes closer to the money (30 to 40 delta) to maximize premium intake. This requires:
- Active weekly management
- Stricter position sizing (5% to 10% per ticker)
- Explicit exit rules to handle equity exposure
You accept higher capital churn to push for absolute performance.
Margin-using operator
Using margin intentionally raises your return on equity (ROE). Because tail risk rises faster than returns, you must prioritize:
- Strict concentration limits
- Scenario planning for market gaps
- Maintaining a 10% to 20% cash reserve
Passive-first investor
The wheel is active portfolio management. If you prefer a hands-off approach, indexing is a better fit for your lifestyle.
Operating like a business
PremiumGuardHQ does not prescribe a strategy. It makes your math and drift visible so you can run your wheel like a business.
Frequently asked questions
What is a realistic wheel strategy average return?
Realistic returns typically range from 8% to 25% annually. Conservative operators selling low-delta puts target the lower end while aggressive traders using margin push for higher figures. These results depend on market regime, ticker selection, and strike aggressiveness. Never rely on premium yield as a standalone success metric. You must account for equity drawdowns and assignment losses to calculate true total return.
Is 1% per month realistic for options income?
Targeting 1% per month is possible but context is everything. This goal is incomplete without defining your capital base, drawdown tolerance, and whether you include assignment losses. Chasing fixed percentages often leads to selling aggressive strikes that increase your risk of ruin. Annualizing a single winning month is a trap that ignores market cycles. Realized income only exists after the cycle closes.
Does the wheel strategy beat SPY or VOO buy-and-hold?
The wheel strategy often outperforms buy-and-hold in sideways or choppy markets where premium collection provides a buffer. However, it typically lags behind SPY or VOO during aggressive bull markets because covered calls cap your upside potential. Always compare total return against benchmarks rather than just looking at premium income. This ensures your active management effort is generating actual alpha over a passive index.
How should I track wheel returns if my broker cost basis looks wrong?
Broker displays often distort cost basis by adjusting for premiums and wash sales automatically. Accurate tracking requires a per-cycle ledger that records every credit against your original strike price. This separates realized premium from unrealized equity swings. PremiumGuardHQ provides this clarity by reconciling raw fills into Premium P/L, Equity P/L, and Net Income views. See the friction stack section above for the breakdown.
Do taxes and wash sales matter for the wheel?
Taxes and wash sales create a significant drag on net returns. Option profits are typically taxed at short-term capital gains rates in taxable accounts. Wash sale rules can also defer losses if you trade the same ticker within 30 days, which complicates cost basis accounting. Consider running the strategy in an IRA to eliminate tax friction. For taxable accounts, consult a tax professional to handle rolling positions.