
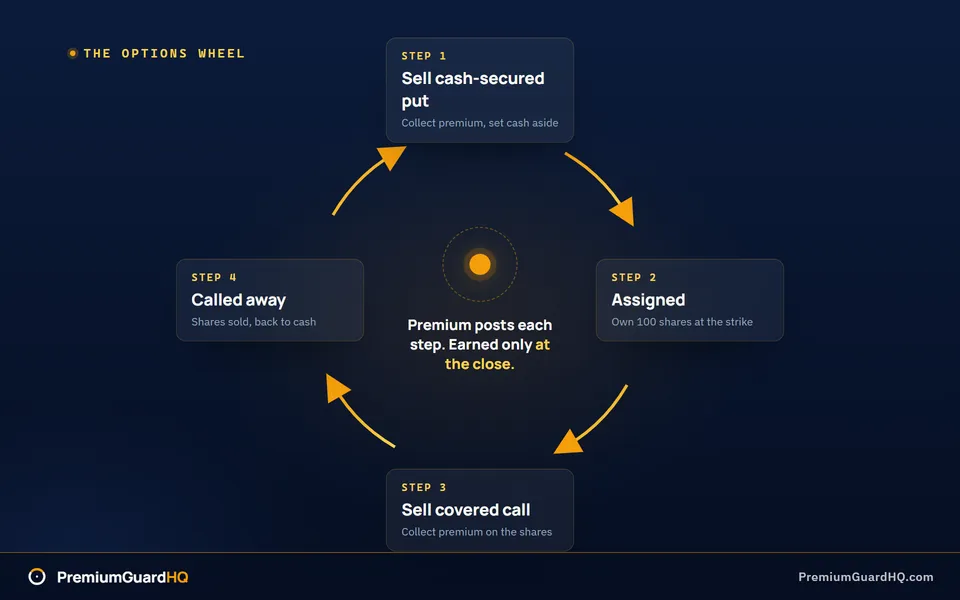
You can learn the wheel strategy in an afternoon. Sell a put. Get assigned shares. Sell a call. Repeat. Those four moves are the whole thing.
But knowing the steps isn’t the same as having a plan. Most losses come from somewhere else entirely: picking the wrong stock, betting too much on one trade, or trusting broker numbers that don’t tell you what actually happened.
By the end, you’ll know the full cycle. You’ll know how to pick your stock, strike price, and DTE, meaning days to expiration. You’ll know what tends to go wrong. And you’ll know how to measure your true income, not just what your broker’s screen shows you.
No stock picks. No predictions. Clear math you can trust.
What the wheel strategy is (plain-English definition)
The wheel strategy is an options income method that repeats two trades on the same stock. First, you sell a cash-secured put, a promise to buy 100 shares at a price you pick, backed by cash you set aside, to collect a payment upfront. If the stock falls and you end up owning the shares, you then sell covered calls, a promise to sell those shares at a higher price, to collect more payments, until the shares are sold.
Think of it as a loop. Cash becomes a put. The put may turn into shares. The shares become a call. The call may turn back into cash. Traders use this loop to collect steady payments, called premium: the money you receive for selling an option. You use it when you are okay owning the stock if the price drops.
The wheel does not remove the risk of owning a stock. If the stock’s price falls a lot, you can still lose money, even after counting the payments you collected. The goal is steady income from those payments, not the biggest possible profit. This is different from just selling covered calls alone, since the wheel also includes the put-selling step that can lead to owning the stock in the first place.
How the wheel strategy works step by step (the full cycle)
The wheel uses two tools: a short put, a bet you sell that pays you cash now but might turn into stock later, and a short call, a bet you sell against stock you already own. Each tool leads to one of two outcomes. Once you see the pattern, the whole cycle is easy to picture.
Step 1: Sell a cash-secured put. Pick a stock you’d be okay owning, and a price below where it trades now. That price is called the strike. You sell a put at that strike and collect cash right away, called the premium. Your broker sets aside cash to cover the purchase in case you have to buy the shares. That’s why it’s “cash-secured.” One contract covers 100 shares, so the cash held back equals the strike price times 100. A $30 strike ties up about $3,000.
From here, one of two things happens.
Step 2A: The put expires OTM, or out of the money. The stock stayed above your strike, so nobody makes you buy shares at a worse price. The put expires worthless. You keep the whole premium, and the cash your broker held back becomes free again. Sell another put and the cycle repeats.
Step 2B: The put gets assigned. The stock fell below your strike, so you’re now required to buy 100 shares at that strike price. This is called assignment. The premium you already collected softens the blow: your real starting cost, your effective entry, equals the strike minus the premium collected.
Quick example: stock trading at $50. You sell the $48 put and collect $1.00. If assigned, you own shares at $48, but you already banked $1.00. So your true cost is $47.00 per share, not $48.
Step 3: Sell a covered call. Now that you own shares, sell a call option against them. It’s called a covered call because you already own the stock backing up the promise. Pick a strike above your effective entry and collect more premium. In exchange, you agree to sell your shares at that strike if the stock reaches it by expiration.
Step 4A: The call expires OTM. The stock stayed below your call strike, so nobody exercises it. You keep the premium, still own your shares, and sell another call.
Step 4B: The call gets assigned, and shares get called away. The stock rose above your call strike, so your shares get sold at that strike, often described as being “called away.” You keep every premium payment collected along the way, plus any gain between your effective entry and the sale price. Your account is back to cash, and the wheel restarts at Step 1.
One thing worth flagging: these steps look clean on paper, but the real math changes with every cycle. Premium collected, the stock’s price swings, and your true cost basis, what you actually paid after every premium payment, all shift together. That’s usually where hand-kept trackers and broker screens start disagreeing, since neither was built to follow a position through assignment and back out again.
The minimum option mechanics you must understand before selling your first put
Before you sell that first put, a few basic facts need to be locked in. Skip these and you’ll get surprised later, usually at the worst time. If you’re still weighing which side to sell first, start with the difference between selling a call and selling a put.
Strike, expiration, premium, intrinsic vs extrinsic. The strike is the price you agree to buy or sell at. Expiration is the date the contract ends. The premium is the cash you collect for selling the option, and it’s made of two parts. Intrinsic value is what the option is worth right now if used immediately. Extrinsic value is everything else: time left until expiration, and how much the stock might still move. As expiration gets closer, extrinsic value shrinks toward zero. This shrinking is called time decay, and it’s a big reason sellers get paid at all.
Cash-secured put vs naked put. A cash-secured put means you set aside the full cash needed to buy 100 shares if you get assigned, or forced to buy the stock. A naked put skips that step. It uses less of your account’s buying power and borrows the rest from your broker. The two look the same day to day, but a naked put can trigger a margin call, your broker demanding more cash, if the stock drops hard. The word “secured” matters here: it’s the difference between a loss you already planned for and one that catches you off guard.
Covered call and the upside cap. When you sell a covered call, you sell someone else the right to buy your shares at the strike price. If the stock rockets past that strike, you still only get paid the strike price. You gave up the extra upside in exchange for the premium you collected upfront. Worth remembering: if you picked a strike above your cost basis, getting called away still means a profit. You gave up the chance at a bigger gain, but you didn’t lose money, and nobody ever went broke taking a profit.
Assignment basics. Equity options are American-style, meaning they can be exercised any time before expiration, not just on the expiration date itself. Assignment, being forced to buy or sell your shares, can technically happen early, especially with calls right before a dividend payment. In practice, most put assignments happen close to expiration, once the stock is trading below your strike, called being in the money, or ITM. Still, plan as if assignment could happen at any time. That mindset avoids nasty surprises.
Delta as a decision input, not a guarantee. Delta is a number between 0 and 1 that roughly estimates the odds an option finishes in the money. Traders say “20 delta” or “30 delta” as shorthand for options with roughly a 20% or 30% chance of ending up assigned. Treat it as a useful estimate, not a promise. Delta also drifts as the stock price moves and time passes, so a 20 delta put today can become a 40 delta put next week without you doing anything.
Liquidity basics. Check two things before you trade: the bid-ask spread, meaning the gap between the buy price and sell price, and open interest, meaning how many contracts are currently active. Wide spreads and low open interest mean worse fills. You get paid less when you sell and pay more when you buy back. These aren’t small details. They directly change how much money actually lands in your account.
Mini example. A put quoted at $1.00 premium is worth $100 per contract, since one contract covers 100 shares ($1.00 x 100). Sell one $48 strike put for that $1.00, and your breakeven if assigned is $47.00 ($48 strike minus $1.00 premium collected), not $48.00. Small premium numbers turn into real dollars fast, and they shift your breakeven every time.
How to choose wheelable underlyings (objective checklist, not vibes)
Before you screen for anything else, answer one question honestly: are you willing to own 100 shares of this stock at your strike price, the price you agreed to buy at, for months, not days? If the honest answer is no, cross the stock off your list right now. Everything else below only matters once that box is checked.
Once that’s settled, run the stock through measurable filters. These aren’t opinions. Copy them into your own process today.
Fundamentals, checked before anything else. A cheap option chain doesn’t fix a bad business. Before you screen for liquidity or IV, look at the company itself: is revenue growing or shrinking, is the business profitable or burning cash, and does it carry a debt load that could force a dilutive raise or a dividend cut if conditions turn. Check the balance sheet for enough cash to survive a rough year. Look at the trend in earnings over the last few years, not just the most recent quarter. None of this predicts the stock’s next move, but it filters out companies where owning 100 shares for months is a bet on survival, not just a bet on price.
Share liquidity. Check average daily trading volume, meaning how many shares change hands per day, and the bid-ask spread on the stock. Thin trading means wide spreads, and wide spreads quietly eat your returns every time you enter or exit.
Options liquidity. This matters even more than share volume. Check the bid-ask spread on the option chain, meaning the list of available strikes and expiration dates, the open interest, meaning how many contracts are currently open at strikes you’d actually use, and whether multiple expirations are offered. A stock can trade fine on the stock market and still have a garbage options chain: wide spreads, thin open interest, only one or two expirations. Skip it.
Event risk. Check the calendar before you sell anything. Avoid selling options that expire after an earnings report, an FDA decision, or active merger rumors. These are binary events. The stock can gap violently overnight, and the premium, meaning cash you collected for selling the option, won’t come close to covering that move.
Why high IV is not automatically good
Implied volatility (IV) is the market’s guess at how much a stock will swing. IV Rank compares today’s IV to its own range over the past year, giving you one number, 0 to 100, showing whether options are cheap or expensive right now for that stock.
Low IV Rank usually means thin premium. You’re not getting paid much to take on the risk, so the trade often isn’t worth doing.
Many premium sellers use an IV Rank above roughly 30 as a baseline entry point. Above that line, you’re typically getting paid a fairer amount for the risk. This is a heuristic, a rough rule of thumb, not a promise. Treat it as a starting filter, not a green light.
Be extra careful at the other extreme. An IV Rank of 80 or higher looks tempting since the premium offered is huge, but ask why. Usually the market is pricing in a real chance of a big gap: earnings, a legal ruling, a takeover rumor. High premium is payment for risk, not free money. Treat extreme IV Rank as a signal to dig deeper, never a reason to size up.
Diversification is part of the strategy, not an afterthought
The wheel is a portfolio strategy. It was never meant to be one favorite stock you wheel forever. Spreading capital across multiple names, sectors, and IV Rank levels protects you the same way diversification protects any equity strategy: one bad gap doesn’t sink the whole account.
This is also where loyalty becomes a quiet risk. Traders keep wheeling the same stock because it “always comes back,” even after it stops paying off. Without a clean, per-ticker record of real outcomes, not just what the broker’s screen shows, that loyalty is a guess dressed up as a strategy. A simple keep-or-cut habit, checking each ticker’s actual track record before selling the next put, turns “I like this stock” into a decision backed by numbers.
Picking the put: strike, delta, and days to expiration (DTE)
Three choices shape every put you sell: the strike, the price you agree to buy at, the delta, a number that estimates your odds of assignment, meaning you end up owning the stock, and the DTE, or days to expiration, meaning how many days until the contract ends. Turn one knob, and the other two move too.
Strike is your real entry price. Picking a strike is less about the option itself and more about the price you’re willing to own the stock at. A strike closer to today’s price pays more premium but raises your odds of owning the shares. A strike further away pays less but lowers those odds.
Delta estimates your odds. A 30 delta put has roughly a 30% chance of finishing in the money, meaning you get assigned the stock. Traders often sell puts in the 20 to 35 delta range. Lower in that range means more caution and smaller premium. Higher means more premium but more assignments.
DTE is the time and premium trade. Options lose value as expiration nears, a process called time decay. Puts with more days left carry more premium, but they also tie up your cash longer. Many wheel traders use 30 to 45 DTE as a starting range, balancing decent premium against flexibility. None of these ranges are rules. They’re starting points, and your own comfort with risk should move them.
Why annualizing premium is tricky. A 2% credit over 30 days is not the same risk as a 24% annualized return, even though the math looks identical (2% times 12 months). Annualizing assumes you repeat the exact same trade, at the exact same odds, all year, with no losing months. That almost never happens. Treat annualized premium as a rough comparison tool, never a promise.
A mini example. Stock trading at $100. Compare two choices:
| Choice | Delta | DTE | Premium |
|---|---|---|---|
| A | 30 | 30 days | $2.50 |
| B | 20 | 45 days | $1.80 |
Choice A pays more per contract ($250 vs $180) and carries a higher assignment chance, since a 30 delta put sits closer to the stock’s price. Choice B pays less, sits further away, and ties up your cash 15 days longer. Choice A also gives more decision points per year, since a 30-day cycle repeats faster. More cycles mean more chances to adjust, but also more fees and more time spent watching the position.
One execution note. Use limit orders, meaning an order that sets your minimum acceptable price, never market orders, when selling options. Check the bid-ask spread first. A wide spread means the quoted premium isn’t what you’ll actually collect.
Capital allocation and margin: what ‘return on capital’ really means for the wheel
Every wheel trade starts with one fact: one contract equals 100 shares. That’s fixed. It decides how much cash gets locked up, and it’s where return on capital, or ROC, meaning how much premium you collected relative to the cash or margin tied up to secure the trade, math either holds up or falls apart.
Cash-secured collateral is simple math. In a cash account, collateral, meaning the money your broker sets aside and won’t let you touch, equals strike price times 100, per contract. Sell a $50 strike put, and about $5,000 gets locked up until the trade closes. Your ROC is just the premium collected divided by that $5,000.
Reg T margin changes the denominator. In a Reg T margin account, a standard margin account most brokers offer, you often don’t need the full $5,000 set aside. The broker may only require a fraction of it. This makes your stated ROC look bigger, since the same premium gets divided by a smaller number. But the actual risk hasn’t shrunk. If you get assigned, you still owe 100 shares at $50. If you don’t resize your position to reflect the lower cash requirement, a drawdown, a stretch where your account value falls, hits just as hard, except now you’re more exposed per dollar you actually have.
Portfolio margin adds another layer, and another warning. A portfolio margin (PM) account calculates collateral using a risk model instead of a flat rule, often freeing up even more cash per contract than Reg T. That can mean real capital efficiency: more contracts per dollar. But it also means you can stack far more risk into the same account without ever hitting a buying-power wall that stops you. The account won’t warn you when you’ve taken on too much. Only your own position sizing will.
Position sizing is what keeps you standing. Say you run a $40,000 account and get assigned 100 shares at $50. That’s a $5,000 position, about 12.5% of the account, which is reasonable. Now say that account holds only two open positions, and one gets assigned at $10,000 worth of stock. That single ticker is now 25% of your entire account. One bad quarter in that stock, and a quarter of your capital moves with it.
This is why “dry powder,” cash kept in reserve and not tied up in any trade, matters. Every assignment converts cash into shares, and shares are less flexible. You can’t redeploy them into a new put, and you’re stuck waiting on a covered call cycle to get liquidity back. An account with no cash left has no room to react if a second position turns against you at the same time.
Most broker screens show buying power and margin requirements, but not a clean view of what percentage of your account sits in one ticker, across every account you hold. Seeing capital at risk by position, and how concentration quietly builds over time, is what keeps position sizing honest, especially once you’re running the wheel across more than one broker.
Managing the short put: when to close, roll, or accept assignment
Once your put is live, you have three moves. Close means buying back the put before it expires, ending the trade early. Roll means closing the current put and immediately selling a new one, usually further out in time, meaning more days left, called DTE, and sometimes at a different strike price, the price you agreed to buy the stock at. Accept assignment means doing nothing and letting the stock get put to you at your strike price.
Two checkpoints tell you when to act. The first is based on profit. Many traders close once they’ve captured somewhere between 50% and 80% of the max profit, the total cash collected when you sold the put, called premium. If you sold a put for $1.00 and it’s now worth $0.30, you’ve captured 70% of that profit. Buying it back locks in the gain and frees your cash for a new trade, instead of risking a small extra gain for weeks of added exposure.
The second checkpoint is based on time. As expiration nears and the stock sits below your strike, decide on purpose instead of by default. Doing nothing is still a choice. It means accepting assignment.
Rolling for a credit means the new put you sell brings in more cash than it costs to close the old one, so you pocket extra money for making the swap. It sounds like a clean win, but it has a catch. More cash usually means a later expiration date or a strike price closer to where the stock trades now, both of which add more exposure to further drops. Rolling isn’t free insurance. It trades one set of risks for another, further down the calendar.
Accepting assignment changes what you hold, not whether the trade worked. Overnight, the cash held aside as collateral, money set aside in case you had to buy the stock, turns into 100 shares of stock per contract. Your risk shifts from a fixed, known amount to full stock exposure. The price can now keep falling with no floor underneath it. Assignment is not automatically a mistake. If you picked a stock you were willing to own, this was always a possible outcome, planned for ahead of time.
Mini example. You sold the $48 put for $1.00. The stock drops to $46 with 7 DTE left. Three paths:
| Action | Result |
|---|---|
| Close | Buy back the put for a loss (it now costs more than the $1.00 you collected), but stop the bleeding and go back to cash |
| Roll | Close this put, sell a new one further out, collect extra cash, but stay exposed longer |
| Accept assignment | Own shares at an effective entry of $47 ($48 strike minus $1.00 premium), even though the stock trades at $46 |
None of these is automatically correct. The right choice depends on whether you still want the stock at that effective entry price, and how that position would sit against everything else in your account.
Managing covered calls after assignment (including the ‘patient wheel’ variation)
Once you own the shares, selling a covered call, meaning you sell someone the right to buy your stock at a set price, does two separate jobs. Don’t blur them together.
Job one: collect cash while you hold the stock. Job two: set the price where you’re happy to sell it. Every strike price you pick leans toward one job or the other.
Where you set the strike changes what you’re doing. Compare it to your cost basis, your true starting price after counting the premium (cash) you already collected.
- A strike above your cost basis aims for a profit on the shares plus extra cash from the call, if the stock gets called away, meaning sold at that strike.
- A strike at or near your cost basis leans harder into cash collection. It pays more premium, but raises the odds the stock gets called away soon.
- A strike below your cost basis is a trap. If the stock gets called away, you lock in a real loss, even after counting every dollar of premium you’ve collected.
That third option is where a useful habit helps: the patient wheel. The rule is simple. Don’t sell call strikes below your assignment price, even if the stock has dropped and those closer strikes pay fatter premium.
Here’s why it matters. After a stock drops, closer strikes look tempting: they pay more, and getting called away feels like an exit. But selling below your basis just to escape the position means selling your way into a loss you didn’t have to take yet. The patient wheel gives up some short-term income for the choice to wait for a real recovery, instead of forcing an exit that locks in the damage.
Rolling a covered call works like rolling a put, in reverse. If the stock rallies through your call strike, you can roll: buy back the current call and sell a new one, usually further out in time and often at a higher strike. This can capture more upside, but it costs you certainty. You traded a guaranteed sale price for a shot at a better one later.
Watch for early assignment around dividends. Calls can get exercised early, before expiration, especially right before a stock’s ex-dividend date, the cutoff day for who receives the next dividend payment. If your call is deep in the money, meaning the stock trades well above your strike, near that date, don’t be surprised if shares get called away early. That’s just how American-style options work, not a mistake on your end.
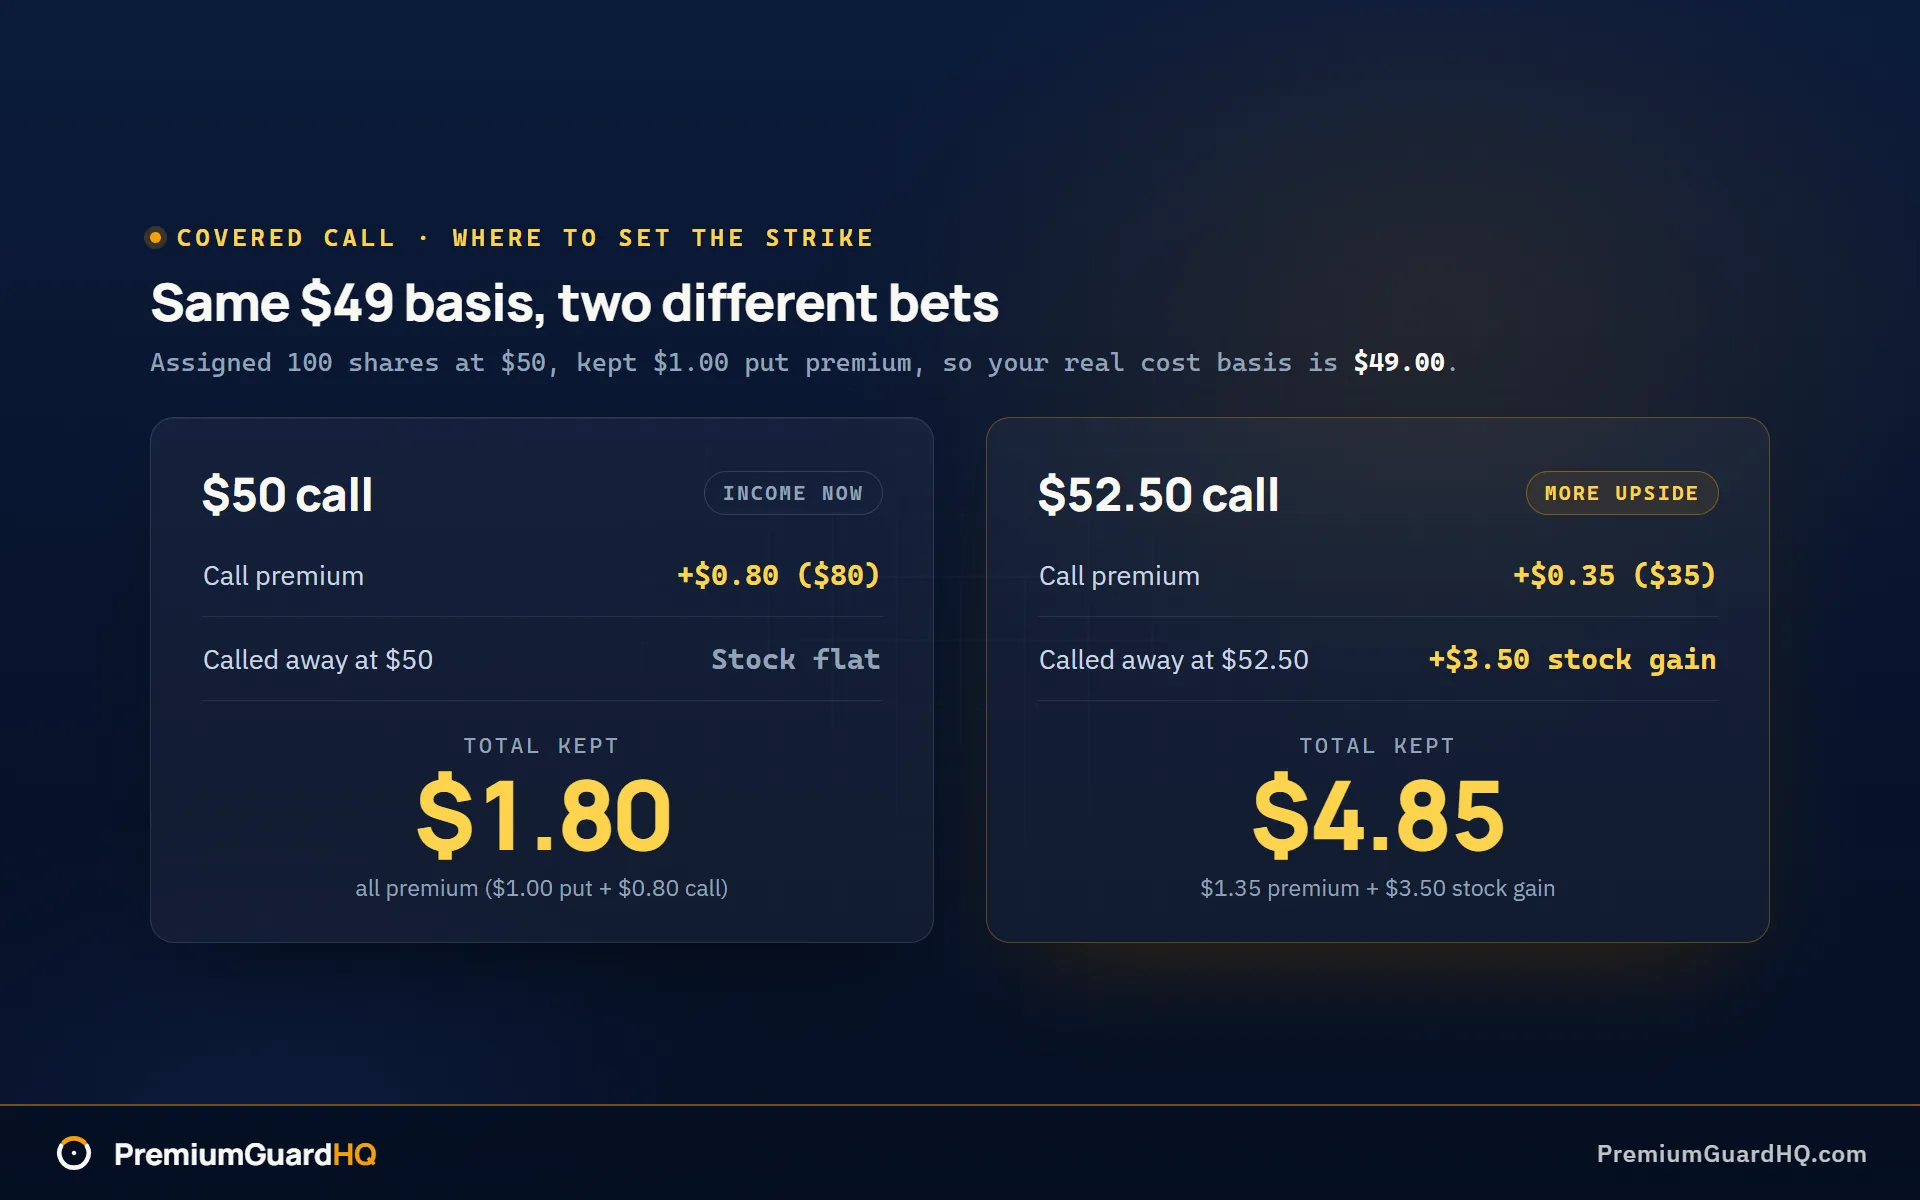
Mini example. You got assigned stock at $50, after already collecting $1.00 of put premium. Your real cost basis is $49.00.
Compare two choices: sell the $50 call for $0.80, or sell the $52.50 call for $0.35.
The $50 call pays more upfront ($80 per contract) and sits right at your basis. If the stock gets called away, you exit flat on the stock but keep $1.80 total in premium ($1.00 put plus $0.80 call), a small profit. The $52.50 call pays less now ($35 per contract), but if called away, you also capture $3.50 in stock gains ($52.50 strike minus $49.00 basis), plus $1.35 total premium collected. Same stock, same starting point, two different bets: income now versus more upside later.
The broken wheel: what to do when the stock drops hard below your strike
Most wheel guides only cover the smooth version: your put expires, or you get assigned and sell calls until the stock gets called away. Almost nobody explains what happens when the stock keeps falling after you own it. That’s the broken wheel. It’s the scenario that decides whether you survive this strategy long term.
Here’s what it looks like. You get assigned shares, meaning you were forced to buy 100 shares per contract because the stock fell below your strike price. Your real cost, called your effective entry, meaning the strike price minus the premium, or cash, you already collected, sits well above where the stock trades now. Maybe 20%, 30%, even 40% below. Any covered call strike above your cost basis pays almost nothing, since the stock is so far under it. You’re holding shares worth much less than you paid, with no easy way to earn real income against them.
This happens because the wheel is, underneath everything, a long equity strategy: you own the stock, plain and simple. Premium is a cushion against small dips, not a shield against a real crash. A stock can fall further in one bad month than months of collected premium ever covered.

Three ways to respond
There’s no single right answer. These are three separate paths, not advice on which to pick.
Hold and wait. Keep the shares. Sell calls only above your cost basis. Accept that premium income drops close to zero while you wait for the stock to recover. This avoids locking in a loss, but your capital sits parked in one stock earning little, for as long as it takes.
Actively manage. Keep adjusting: roll calls out to a later date, choose strikes that balance some income against your exit price, or sell calls closer to the current price. This keeps some cash coming in, but usually means accepting a smaller profit, or even a loss, if the stock recovers just enough to get your shares called away below your true cost.
Exit and redeploy. Sell the shares now, lock in a real loss, and move that money into a new position. This comes down to opportunity cost: capital stuck in a dead stock for a year isn’t earning anything elsewhere either.
The real tradeoff: time and capital lock-up
Every path is really a choice about how long your money stays tied up, and how sure you are the stock comes back. Waiting costs you the income that same money could earn elsewhere. Exiting costs you a real loss today, in exchange for freedom to redeploy the cash. There’s no version of this where you avoid a cost entirely.
A numeric reality check
Say a stock drops 25% below your effective entry after assignment. Over the next several months, careful call selling might bring in another 3% to 8% in premium. That does not erase a 25% drawdown. It softens it slightly. Anyone claiming premium “protects” you from a real crash is skipping the math.
Reducing how often this happens
You can’t eliminate the broken wheel, but you can cut how often it hits and how badly.
- Diversify across multiple stocks, so one bad drop doesn’t sink your whole account.
- Cap position size: never let one stock grow past a set percentage of your capital.
- Avoid binary events, like earnings reports or FDA decisions, landing inside your expiration window.
- Treat high IV, the market’s guess at how much a stock will swing, as a warning to check, not a green light to sell.
This is also why separating your numbers matters most during a drawdown. Premium income and stock value swings are two different things. Confusing them is how traders convince themselves a losing position is “working” just because the calls keep expiring worthless. A clean, per-cycle view of premium collected versus what the shares have actually lost is what tells you honestly whether you’re managing a broken wheel, or just watching one slowly drain your account.
Returns and expectations: income, total return, and the buy-and-hold comparison
Traders mix up three numbers when they talk about wheel returns. Pulling them apart is the difference between an honest scorecard and a story you tell yourself.
Premium income is the cash you collect from selling puts and calls. That money is real the moment it hits your account. Equity P/L, profit or loss on the stock itself, is what happens to the shares you hold while assigned, meaning the stock got put to you and you now own it. If the stock drops 20% while you hold it, no amount of call premium erases that loss. Total return is the two added together: every dollar of premium collected, plus or minus whatever the stock did.
A trader who tracks only premium can look profitable every month and still be losing money overall, if the shares keep sliding faster than the premium comes in. That’s the broken wheel from the last section, seen through numbers instead of mechanics.
Here’s the part that surprises people: the wheel can lag a strong bull market, and that’s normal, not a sign something’s wrong. A covered call, your promise to sell shares at a set price, called the strike, caps your upside there. When stocks keep climbing, your winners keep getting called away, and you re-enter at similar or higher prices. You collect steady premium but miss the long, uninterrupted run a plain buy-and-hold investor would have ridden.
Backtests on broad index wheels show this pattern often enough to matter, though this is illustrative, not a promise of future results. Month-to-month results run smoother. The Sharpe ratio, a measure of return per unit of risk taken, sometimes comes out better. But total return often lags just holding the index through a long bull run. The wheel trades some upside for a steadier ride. Whether that trade is worth it depends on what you’re optimizing for.
One more caution: a monthly premium number is not an annual rate. A 2% monthly credit is not a locked-in 24% a year. That math assumes every month looks like this one, with no big drop in between. One bad assignment, one broken wheel, can wipe out months of steady-looking gains. The tail event, the rare sharp loss, not the average month, tends to decide the real annual number.
None of this means the wheel is bad. It means the goal isn’t a headline premium percentage. It means running a repeatable process with risk you’ve actually measured, cycle after cycle.
This is why separating Premium P/L, Equity P/L, and Net Income for every cycle matters. When the market shifts from calm to volatile, or from rising to falling, a trader tracking only premium keeps believing the strategy is working right up until the equity losses show up. Seeing all three numbers side by side, every cycle, is what keeps that self-deception from creeping in.
Taxes and tracking: wash sales, Section 1256, and why broker cost basis can mislead
Quick note first: this is a plain-English overview, not tax advice. Your taxes depend on your own situation. Talk to a real tax professional before you file anything.
Here’s why wheel taxes get messy fast. Most options you sell in this strategy last only a few weeks. That means most gains and losses count as short-term (held one year or less), taxed at your regular income rate instead of the lower long-term rate. The wheel also creates a lot of trade records. Every close, every roll, every assignment adds another entry. A trader running ten positions a month can rack up hundreds of tax lots, meaning individual trade records, in a single year.
Wash sales, explained simply
A wash sale is a rule that delays a loss. If you sell something at a loss, then buy something “substantially identical” within 30 days before or after, that loss doesn’t count yet. It gets added onto the cost of your new position instead, and you deduct it later.
Here’s why this trips up wheel traders. Say you close a losing put, then sell another put on the same stock a few days later. That second put can count as “substantially identical” to the first. If it does, your loss doesn’t show up as a deduction right now. It gets folded into the new trade’s cost basis, the number used to figure gain or loss later. Roll a losing put often enough, and you build a chain of deferred losses that never quite show up where you expect them.
Section 1256 contracts: a different rulebook
Some options, mainly broad-based index options, like options on the S&P 500 index itself rather than an ETF that tracks it, fall under Section 1256 of the tax code. These get 60/40 treatment: 60% of the gain or loss counts as long-term, 40% as short-term, no matter how long you actually held the contract. They’re also marked to market, meaning any open position at year-end gets treated as if you sold it on December 31st, for tax purposes only.
Regular equity options, the kind used in a standard wheel on individual stocks, don’t get this treatment. They’re taxed the normal way, based on how long you actually held them. This matters if you’re comparing an index-based wheel to a single-stock wheel. The tax outcome differs even when the trades look identical on screen.
Why the broker’s cost basis can mislead you
Your broker adjusts the displayed cost basis for wash sales and for premium received. That adjustment is correct for tax reporting. But it often doesn’t match what you, as a trader, think of as your cycle profit or loss: what you actually made or lost from opening a position to closing it.
Mini example. You close a losing put for a $200 loss. Three days later, you sell a new put on the same stock. If the wash sale rule applies, that $200 loss doesn’t show up right now. It gets tacked onto the cost basis of the new put instead. Your broker’s screen might show a strange cost basis, or a realized loss smaller than what you actually felt, because part of it is sitting deferred inside a position you haven’t closed yet.
Multiply that across dozens of rolls in a year, and the broker’s running numbers stop telling a clean story of what you actually earned.
This is the gap that matters most for anyone treating the wheel like real income, not a hobby. Premium collected is not the same as tax-adjusted cost basis, and neither one alone tells you your real cycle result. Separating Premium P/L, Equity P/L, and Net Income on a per-cycle basis, reconciled against real fills instead of one adjusted number, is what lets a trader defend their actual numbers to an accountant, or to themselves, instead of guessing from a screen built for tax filing, not for judging a strategy.
A complete wheel cycle example with real math (put to assignment to calls to exit)
Here’s one full cycle, start to finish, with every dollar tracked.
The setup. A stock trades at $50. You sell a cash-secured put, a put backed by cash set aside to buy the stock if needed, at the $48 strike, 30 DTE, meaning days to expiration. You collect $1.20 in premium, or $120 per contract. Your broker holds back $4,800 in collateral, since one contract covers 100 shares at $48.
Assignment. The stock drops to $47.50 by expiration, below your $48 strike. You get assigned: forced to buy 100 shares at $48. Your $4,800 in reserved cash simply becomes 100 shares. You already banked $1.20 per share, so your effective basis, your real cost after counting premium, is $48.00 minus $1.20, or $46.80.
The covered call. Now holding shares, you sell a 30 DTE covered call at the $50 strike, collecting $0.70 per share, or $70 per contract. That lowers your effective basis again: $46.80 minus $0.70 equals $46.10.
The exit. The stock rallies past $50. Your shares get called away, sold at your $50 strike, at expiration.
- Equity gain: $50.00 sale price minus $48.00 original purchase price equals $2.00 per share, or $200 per contract.
- Premium income: $1.20 (put) plus $0.70 (call), times 100 shares, equals $190.
- Total P/L for the cycle, before fees and taxes: $200 plus $190, or $390.
Notice the equity gain used your original $48.00 purchase price, not your $46.10 effective basis. That’s intentional. Effective basis tells you your breakeven along the way, useful for judging whether a call strike is safe to sell. But the real profit for the whole cycle only shows up once you add stock gains and total premium together, from the first put to the final sale.
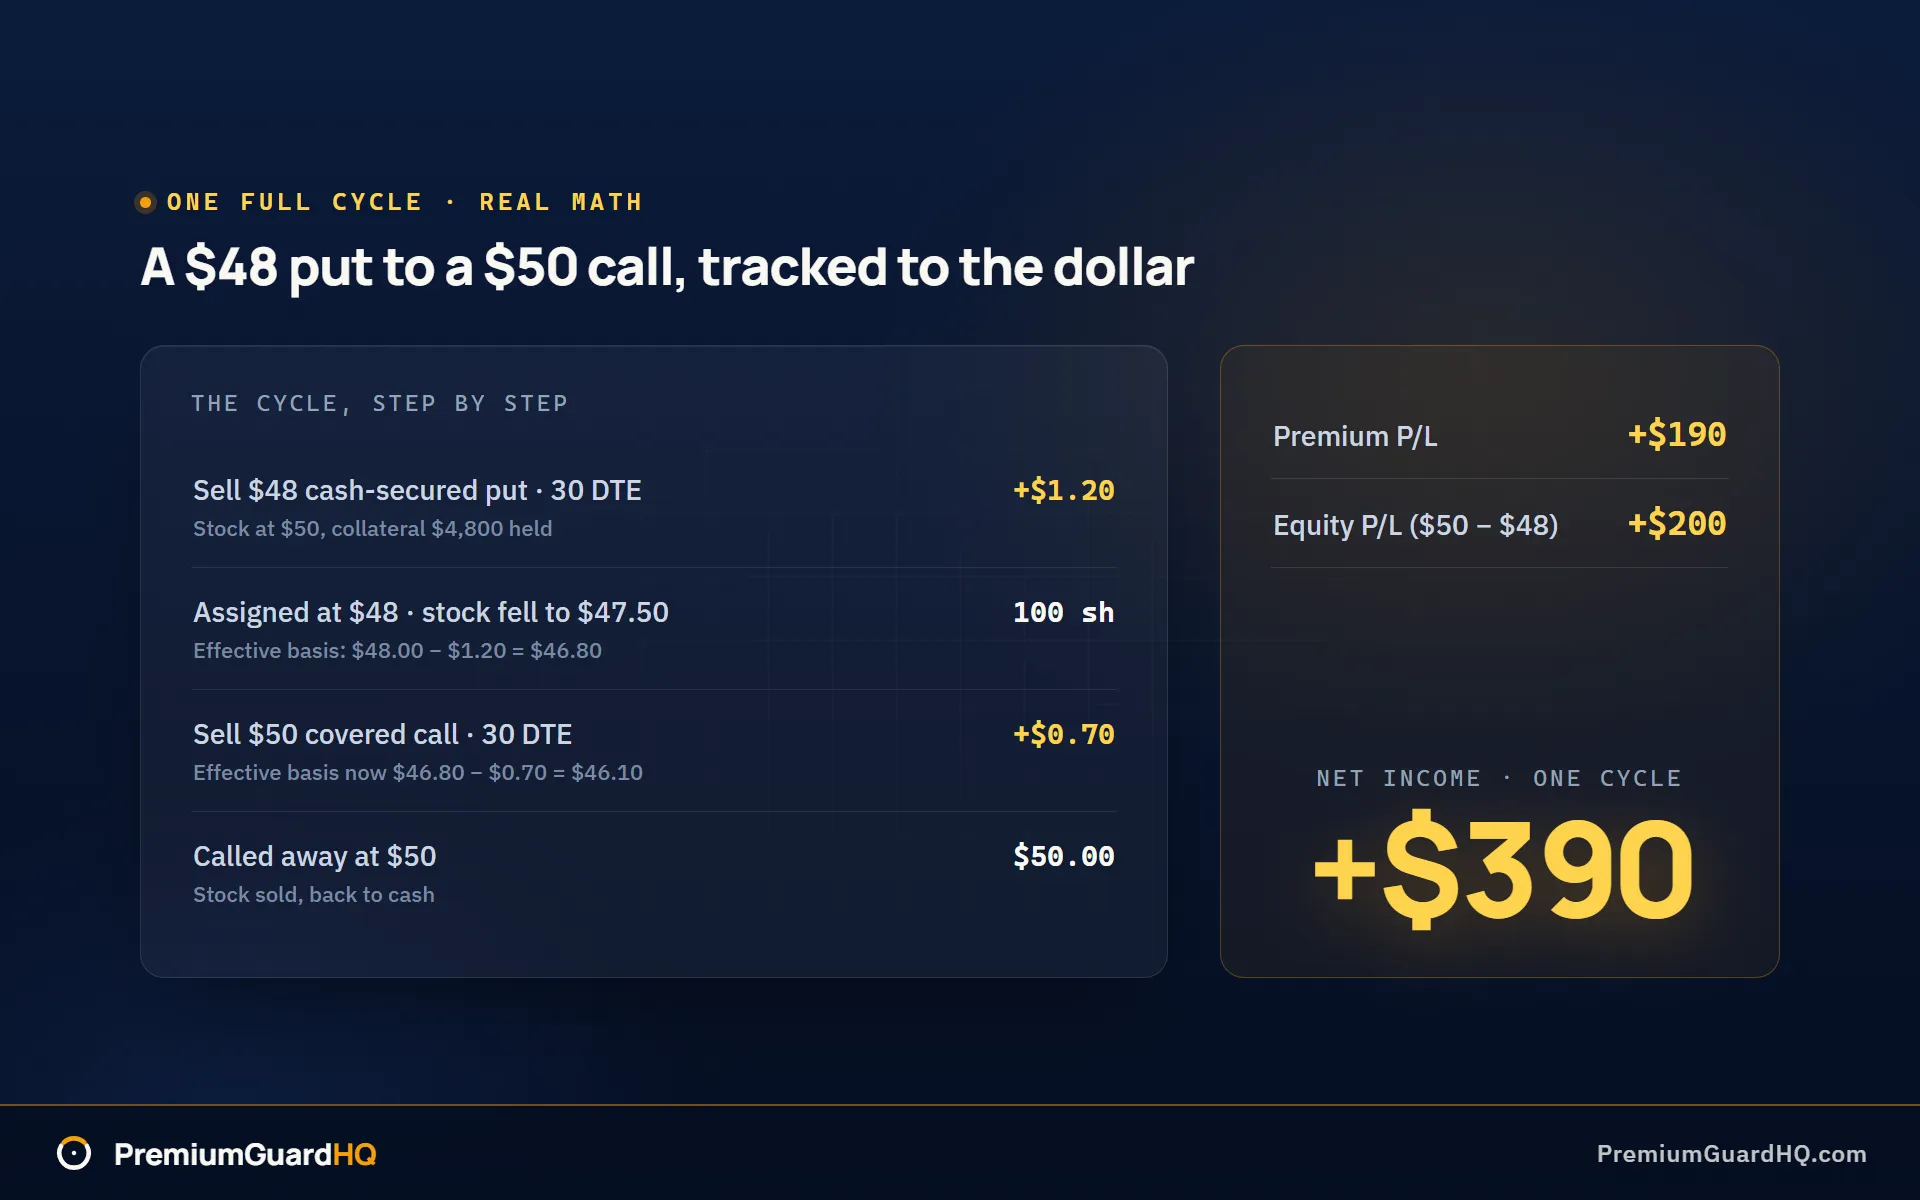
This is what the numbers prove. Premium did two jobs: it lowered your basis at every step, and it added cash flow you’d have missed by just buying and holding the stock. Total return was never one number sitting in isolation. It was equity gain plus premium, measured per complete cycle, not per trade.
Pros, cons, and the risks that actually matter in wheel trading
The mechanics work. But mechanics working and a trade being safe are two different things. Here’s the honest scorecard.
What the wheel does well:
- Recurring premium can smooth cash flow. Selling puts, agreeing to buy a stock at a set price, and calls, agreeing to sell it at a set price, on a schedule brings in cash regularly, instead of waiting on price swings alone.
- It systemizes entries on stocks you already want to own. Instead of guessing when to buy, you get paid while you wait for your price. That’s the wheel’s best case.
Where it costs you:
- The stock can still fall hard. Premium, the cash you collect for selling the option, is a small cushion, not armor. A 25% drop in the stock easily beats months of collected premium.
- Upside gets capped. Once you’re selling covered calls, a stock that runs past your strike price, the price you agreed to sell at, still gets sold at that strike. You miss the rest of the climb.
- Cash and shares sit tied up. Collateral, cash held back to cover a put, and assigned shares both lock up capital. That money earns nothing else while it waits, especially during a long drawdown.
- Earnings and gaps can blow through your plan. A stock can jump or drop overnight past any strike you picked, especially around an earnings report. No premium collected covers a real gap down.
- Tax and recordkeeping pile up fast. Wash sales, a tax rule that can delay your loss deduction, short-term tax rates, and hundreds of trades in a busy year make this messier than it looks from the outside.
Behavioral risk deserves its own line. Most account blowups don’t come from a bad stock. They come from a trader quietly drifting: pushing strikes closer to the current price after a hot streak, skipping the stock check because the premium “looked too good,” or letting one position grow past the size they meant to allow. The market rarely punishes the plan. It punishes the moment you stopped following it.
One more risk hides in the numbers themselves. If you only watch your broker’s screen, you can mistake premium for spendable income during a drawdown. Pull that “income” out while the shares underneath are quietly losing value, and you’ve shrunk the very engine generating it. Separating what you collected from what the stock actually did is the only way to know if you’re paying yourself, or paying yourself with your own capital.
Is the wheel strategy right for you? Use-case filters
You’re a good fit if you want steady income, you’re okay owning shares if a put gets assigned, meaning the stock gets put to you at the strike price, and you’re willing to track every cycle closely instead of guessing.
Go slower if you might need your cash back soon. Assignment can lock money into shares for weeks or months. If you tend to roll a losing put, extending it to a later date to avoid taking the loss, just to dodge facing the loss, that habit gets expensive fast.
This probably isn’t for you if you want big, fast gains, can’t stomach watching a stock drop while you hold it, or want income that runs itself with zero attention. The wheel needs real, ongoing involvement. Skip that part and you defeat the purpose.
A few questions worth answering honestly:
- Can you hold assigned shares through a drawdown, a stretch where the stock’s value falls, without forcing a bad covered call just to escape?
- Do you have a written rule for how much money goes into each position, and for spreading risk across different stocks?
- Could you explain your per-cycle profit or loss, the premium you collected plus or minus what the stock did, in a way an accountant would accept?
If you hesitated on any of these, that’s useful information, not a failure. It tells you where to build a rule before you trade, not after a costly mistake.
One last point worth remembering: the decision to open, roll, or hold a position is always yours. No tool makes that call for you. What actually helps is seeing the real math behind each choice, clearly, every time, so the decision you make is an informed one.
Frequently asked questions
Is the wheel strategy bullish or neutral?
It’s neutral to mildly bullish. You’re not betting on a big rally. You’re betting the stock stays flat, drifts up slightly, or dips a little without falling off a cliff. The strategy makes money because you’re willing to own the stock, as covered in the earlier sections, so flat and slow-grinding-up markets are its best conditions. Sustained downtrends are where it hurts most, since falling shares can lose more than the premium, cash collected from selling options, ever covers. That’s the broken wheel scenario discussed above.
Does the wheel strategy beat buy-and-hold?
Sometimes, on a risk-adjusted basis. Rarely, on raw return, during a strong bull market. Selling covered calls caps your upside: once the stock climbs past your strike price, the price you agreed to sell at, your shares get sold there, and you miss the rest of the climb. Buy-and-hold investors keep riding. The wheel trades some of that upside for steadier, smoother income and often a smaller Sharpe ratio drawdown, a measure of return per unit of risk. Whether that trade is worth it depends on what you’re optimizing for, as covered in the returns section above.
What IV Rank is “good” for starting a wheel?
Many traders use an IV Rank above roughly 30 as a rough starting filter, since it usually means you’re getting paid a fairer amount for the risk you’re taking. This is a heuristic, a rough rule of thumb, not a guarantee of a good trade. Be cautious above 80. Sky-high IV Rank often means the market is pricing in real event risk, earnings, an FDA decision, a legal ruling, not handing you free money. Always check the calendar before you sell, regardless of the number.
Can I get assigned early on a covered call?
Yes. Equity options are American-style, meaning they can be exercised any time before expiration, not just on the expiration date. Early assignment on a covered call is most common right before a stock’s ex-dividend date, the cutoff day for who gets the next dividend, especially if your call is deep in the money, meaning the stock trades well above your strike. It’s just how these contracts work, so plan for it rather than being surprised by it.
How do I track wheel income correctly if my broker’s cost basis looks wrong?
Your broker adjusts displayed cost basis for wash sales, a rule that delays a loss deduction, and premium received, which is correct for tax filing but doesn’t match your real cycle profit or loss. Track income at the cycle level instead, from the first put sold to the final exit, using three separate numbers:
- Premium P/L: cash collected from every put and call sold in the cycle
- Equity P/L: gain or loss on the shares themselves, from purchase to sale
- Net Income: the two combined, your real result for that cycle
This is the reconciliation gap tools like PremiumGuardHQ are built to close: a per-cycle ledger that traces back to actual fills, so the three numbers stay auditable without you rebuilding a spreadsheet by hand every time a position gets assigned.