
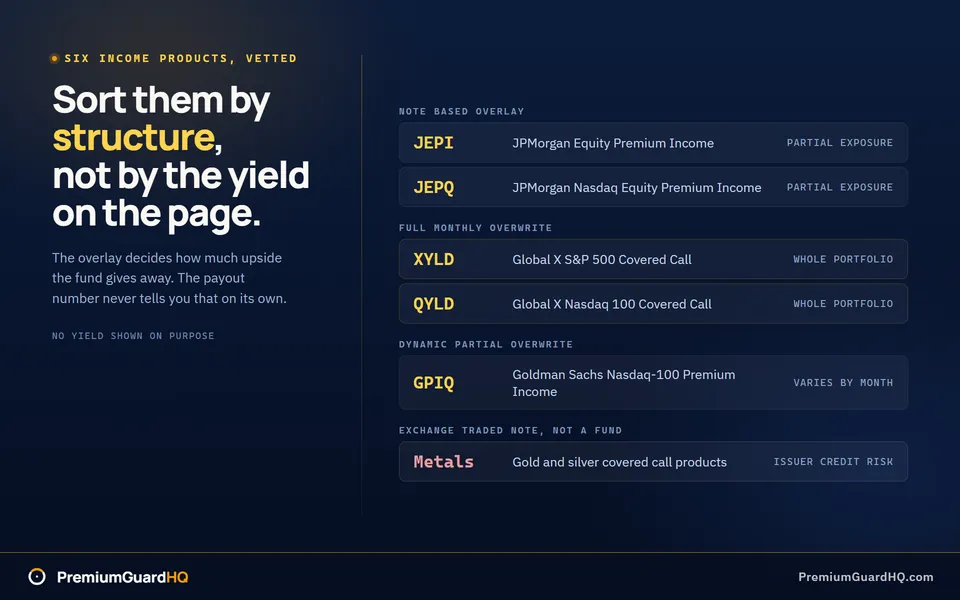
You have seen the lists. “Top 10 Highest-Yield Covered Call ETFs.” One fund shows a 14% payout next to another paying 7%, like the answer is obvious.
It is not.
A covered call ETF holds stocks and sells call options against them, then hands you the option premium as cash. A call option gives someone the right to buy a stock at a set price. Selling one for premium can look like pure income, but there is usually more going on. A high payout number can hide a cap on how much the fund can grow, a shrinking share price, and cash that is partly just your own money coming back to you.
There is no single “best” covered call ETF. There is only the fund that fits what you are trying to do with your money. Below you get six real funds to look at, plus a short checklist to run before you buy any of them. It covers how the fund is built, how it performs over time, how it is taxed, and what is actually inside that payout.
1. JPMorgan Equity Premium Income ETF (JEPI)
JEPI is the fund most people mean when they say “covered call ETF.” It is one of the biggest income funds on the market, which is exactly why its big yield number needs a second look.
Here is what JEPI actually is in one line. It holds a basket of large U.S. stocks and adds income on top using options tied to that basket. JEPI does not sell a call option against each stock it owns like a classic covered call fund. Instead, it uses an ELN.
ELN is short for equity-linked note. It is a contract with a bank that pays out based on how a group of stocks performs, combined with selling call options on that group. JEPI collects options income this way without managing separate option trades on every holding.
JEPI made this list for three reasons: it is huge, it is easy to trade, and its cost is low compared to similar funds. It also caps less upside than funds that sell calls on every dollar of stock every month.
What the yield hides. JEPI sells calls on part of its stock exposure. That means it gives up some gains when stocks rally hard. In a strong bull market, expect JEPI to lag a plain S&P 500 index fund. Smoother, income-heavy returns come at the cost of a lower ceiling.
For the actual numbers, check JEPI’s own site for the current distribution yield, SEC yield, expense ratio, and total assets. Note the date you look. These figures change monthly.
One more thing before buying in a regular taxable account. Income from ELN-based strategies has generally been treated as ordinary income, not qualified dividends. That is a structural fact worth knowing, not a tax claim about your situation. Check with a tax professional before assuming how your payouts will be taxed.
Before you buy: pull the latest fact sheet. Check the overlay description, any caps or limits, and what makes up the distribution. Red flag: treating JEPI like a bond. It holds stocks. Watch total return and share price over time, not just the monthly check.
2. JPMorgan Nasdaq Equity Premium Income ETF (JEPQ)
JEPQ takes the JEPI playbook and points it at tech stocks instead of the whole market. Same recipe, hotter pan.
What it is. JEPQ holds stocks from the Nasdaq-100. That is an index of the 100 biggest non-financial companies on the Nasdaq exchange, packed with names like Apple, Microsoft, and Nvidia. Like JEPI, JEPQ does not sell a call option on every stock it owns. It uses an ELN, short for equity-linked note. That is a contract with a bank that pays out based on how the stock basket performs, combined with call-selling. The structure creates the income JEPQ pays out each month.
JEPQ made this list for the same reasons as JEPI. It is large, it trades easily, and it gives you a clean comparison point against other Nasdaq income funds like QYLD. The difference is the tilt. Tech-heavy holdings mean tech-heavy option premiums. Tech stocks also tend to have higher implied volatility, a measure of how much the market expects a stock to swing. Bigger expected swings mean fatter option prices, which is why JEPQ’s headline yield usually runs hotter than JEPI’s.
What the yield hides. A juicier payout is payment for a bumpier ride. When Nasdaq stocks drop hard, and they have a habit of doing that, JEPQ drops with them. The option premium cushions the fall a little, but it does not stop it. You are riding a handful of concentrated tech names, not a diversified slice of the market.
The upside cap still applies. Just like JEPI, JEPQ gives up gains when stocks rip higher, because the calls it sold put a lid on what it can capture. A higher yield does not mean a higher ceiling. The ceiling stays just as capped while the floor gets shakier.
For JEPQ’s current distribution yield, expense ratio, and total assets, check the fund’s own site. Note the date you check. These figures move monthly, and any historical figure is not a promise of future payouts.
Best fit: you understand you are trading market-wide diversification for concentrated tech exposure, and you are using JEPQ deliberately to smooth out cash flow, not as your only income holding.
Poor fit: you want JEPQ to behave like QQQ during a tech rally. It will not. The calls it sold will eat into those gains every time.
3. Global X S&P 500 Covered Call ETF (XYLD)
XYLD does what most people picture when they hear “covered call ETF.” It sells a call option on the whole S&P 500 (the 500 largest U.S. companies), every month, against 100% of what it holds. A call option is a promise to sell stock at a set price by a set date. Selling one against stock you own is a covered call.
What it is. XYLD owns the S&P 500 stocks. Then it sells a call option covering the entire portfolio, one month at a time, forever. This is called a full overwrite, and it gives up almost all of the upside past the strike price, the set sale price, so the fund can collect the biggest premium check it can.
This is the purest version of the strategy. Every other fund on this list is a variation or a partial version of what XYLD does at full strength.
What the yield hides. A full overwrite means a full cap. If the S&P 500 jumps 8% in a month, XYLD holders mostly do not feel it. The call gets exercised near the strike price the fund picked. You keep the premium either way, but you miss most of the stock gain on top. That is the ceiling you accept when you sell a call, applied to an entire index at once.
There is an upside to this trade-off. In flat or choppy markets, XYLD tends to shine. No big rally to miss means the monthly premium becomes the main event, not a consolation prize.
Watch the NAV, the actual value of what the fund holds per share. A high payout next to a shrinking NAV over several years is worth understanding before you buy, not after. Pull XYLD’s current distribution yield, expense ratio, and NAV history straight from the fund’s own site, and note the date you checked.
Best fit: sideways or slow-grind markets, and income that does not need to outrun a bull run.
Poor fit: expecting XYLD to keep up with the S&P 500 in a strong up year. That is not the trade you signed up for.
4. Goldman Sachs Nasdaq-100 Premium Income ETF (GPIQ)
Ask this before buying any newer fund: what happens when it hits a market it hasn’t lived through yet? GPIQ is a good test case. It is cheap, well-built, and untested across a full market cycle.
What it is. GPIQ holds stocks from the Nasdaq-100, the 100 largest non-financial companies on the Nasdaq exchange. Then it sells call options against that stock to generate monthly income. A call option is a promise to sell stock at a set price by a set date. Selling one against stock you already own is called a covered call. That is how this whole fund category makes money.
GPIQ made this list for two reasons. Its fee is competitive against older, bigger Nasdaq income funds. And it is a clean, simple choice if you want Nasdaq income without sorting through a dozen near-identical products.
What the headline yield hides. A short track record means less proof. Older funds like QYLD have traded through crashes, rallies, and everything between. GPIQ has not had that stretch of time. That is a gap in the evidence you get before committing money.
Strike price selection matters more than most people think. This is the price at which the fund agrees to sell the stock. Some funds pick a price close to the current stock price. Others pick one farther away. This choice controls how much upside gets capped, so two funds holding identical stocks can perform very differently.
For GPIQ’s exact expense ratio, assets under management, and yield, check the fund’s own site directly. Note the date you looked. These figures shift often, and any number pulled from an old article may already be stale.
Due diligence that actually matters here. Check liquidity first. Look at the bid-ask spread, which is the gap between the buying price and selling price, and check daily trading volume before placing any real size. A fund can look great on paper and still trade poorly if too few shares change hands each day.
Then compare GPIQ directly against JEPQ and QYLD. JEPQ uses a note-based overlay, so it caps less upside than a fund that sells calls on the whole portfolio. QYLD has the longest history in this space, for better or worse. GPIQ sits between them on cost and structure, with less time in the market to prove itself.
Best fit: you want Nasdaq income at a competitive fee and you are comfortable being an early adopter.
Poor fit: you need a long track record before trusting a strategy with real money.
5. Global X Nasdaq 100 Covered Call ETF (QYLD)
QYLD is famous for one thing: a huge yield number. That number is real. What it costs you is the part most people skip.
What it is. QYLD holds the Nasdaq-100, the 100 largest non-financial companies on the Nasdaq exchange. Every single month, it sells a call option against the whole portfolio. A call option is a promise to sell stock at a set price by a set date. Selling one against stock you already own is called a covered call. QYLD sells calls on its entire portfolio every month. This is called a full overwrite, the same style XYLD uses on the S&P 500. QYLD just does it on tech stocks.
QYLD made this list because it is simple, huge, and has run this same playbook longer than almost any fund like it.
What the headline yield hides. A full overwrite means a full ceiling. Tech stocks rip higher often, and when the Nasdaq-100 rallies hard, most of that gain gets capped by the calls the fund sold. QYLD holders watch it happen. You get paid either way. But in a strong rally year, you will lag the index by a wide margin. That is the design.
The yield number also is not fixed. Distributions can drop when implied volatility falls. Implied volatility measures how much the market expects a stock to swing around. Lower expected swings mean the options bring in less premium, so the checks shrink some months. A payout that was $0.20 last month can be $0.15 this month. That is normal for this fund, not a sign something broke.
Any distribution or yield figure for QYLD needs a date attached to it. Pull current numbers from the fund’s own site and note the day you checked. Treat every figure as historical, never as a promise of what next month pays.
What to check before calling this “income.” Look at NAV, the actual value of what the fund holds per share, and total return over several years. Do not just look at the monthly cash hitting your account. QYLD has a long history of a declining share price alongside its payouts, and you need to weigh those together as one story.
Also check how the fund classifies its distributions. Some of QYLD’s payout has been reported as return of capital, which is a payment out of your own invested money rather than profit. Pull the fund’s distribution notices and tax documents to see how a specific payout was classified before you count it as earnings.

Best fit: flat or choppy Nasdaq stretches, when you use QYLD’s cash flow deliberately instead of treating the yield as free money.
Poor fit: any year the Nasdaq-100 rallies hard. You will feel that cap every time.
6. Precious metals income ETNs (gold and silver covered call products)
Search for “gold covered call ETF” and you likely land on something that is not an ETF at all. That mismatch matters.
What these are. These are gold and silver income products. They use an option-selling strategy like the stock funds above. People search for them because they want gold and silver income, the same way they want stock income. But the risk underneath is very different, and it needs its own explanation.
What the headline yield hides. Many of these products are ETNs, not ETFs. ETN stands for exchange-traded note. An ETF owns real assets that belong to you. An ETN is an unsecured debt promise from the firm that issued it. You trust that issuer to pay you what the note is worth. If that issuer runs into serious money trouble, your note can lose value for reasons that have nothing to do with gold or silver prices. This is called issuer credit risk. Stock covered call ETFs do not carry this risk.
Second, gold and silver pay no dividends. A stock covered call fund stacks option premium on top of dividend cash the stocks already make. A metals income product has no dividend under it at all. The entire “income” comes from option premium alone. That makes the payout thinner and shakier than it looks.
Third, the same upside cap from every fund on this list applies here too. A strong gold or silver rally can get cut short by the calls the product sold. This works the same way a stock rally gets capped in JEPI or QYLD.
Before you buy. Check the exact product type, the issuer’s name, the fee, and the latest payout numbers. Write down the date you checked. Find out who actually stands behind the note.
This category fits someone who already understands credit risk and still wants metals income. It does not fit someone looking for a simple, safe gold play. If credit risk or added complexity worries you, skip this one.
How to vet any covered call ETF before you buy
The six funds above are a starting point. They are not a final answer. “Best” only means one thing here. It means the fund whose structure, payout, and tax treatment match what you want to do with your money. Three things decide that fit.
Total return and NAV path. Total return means price change plus payouts, added together. NAV is short for net asset value. It is the actual value of what the fund holds, per share. A fund can pay a big monthly check and still lose you money if the NAV keeps sliding underneath it. Check both across different market conditions, not just one calm stretch.
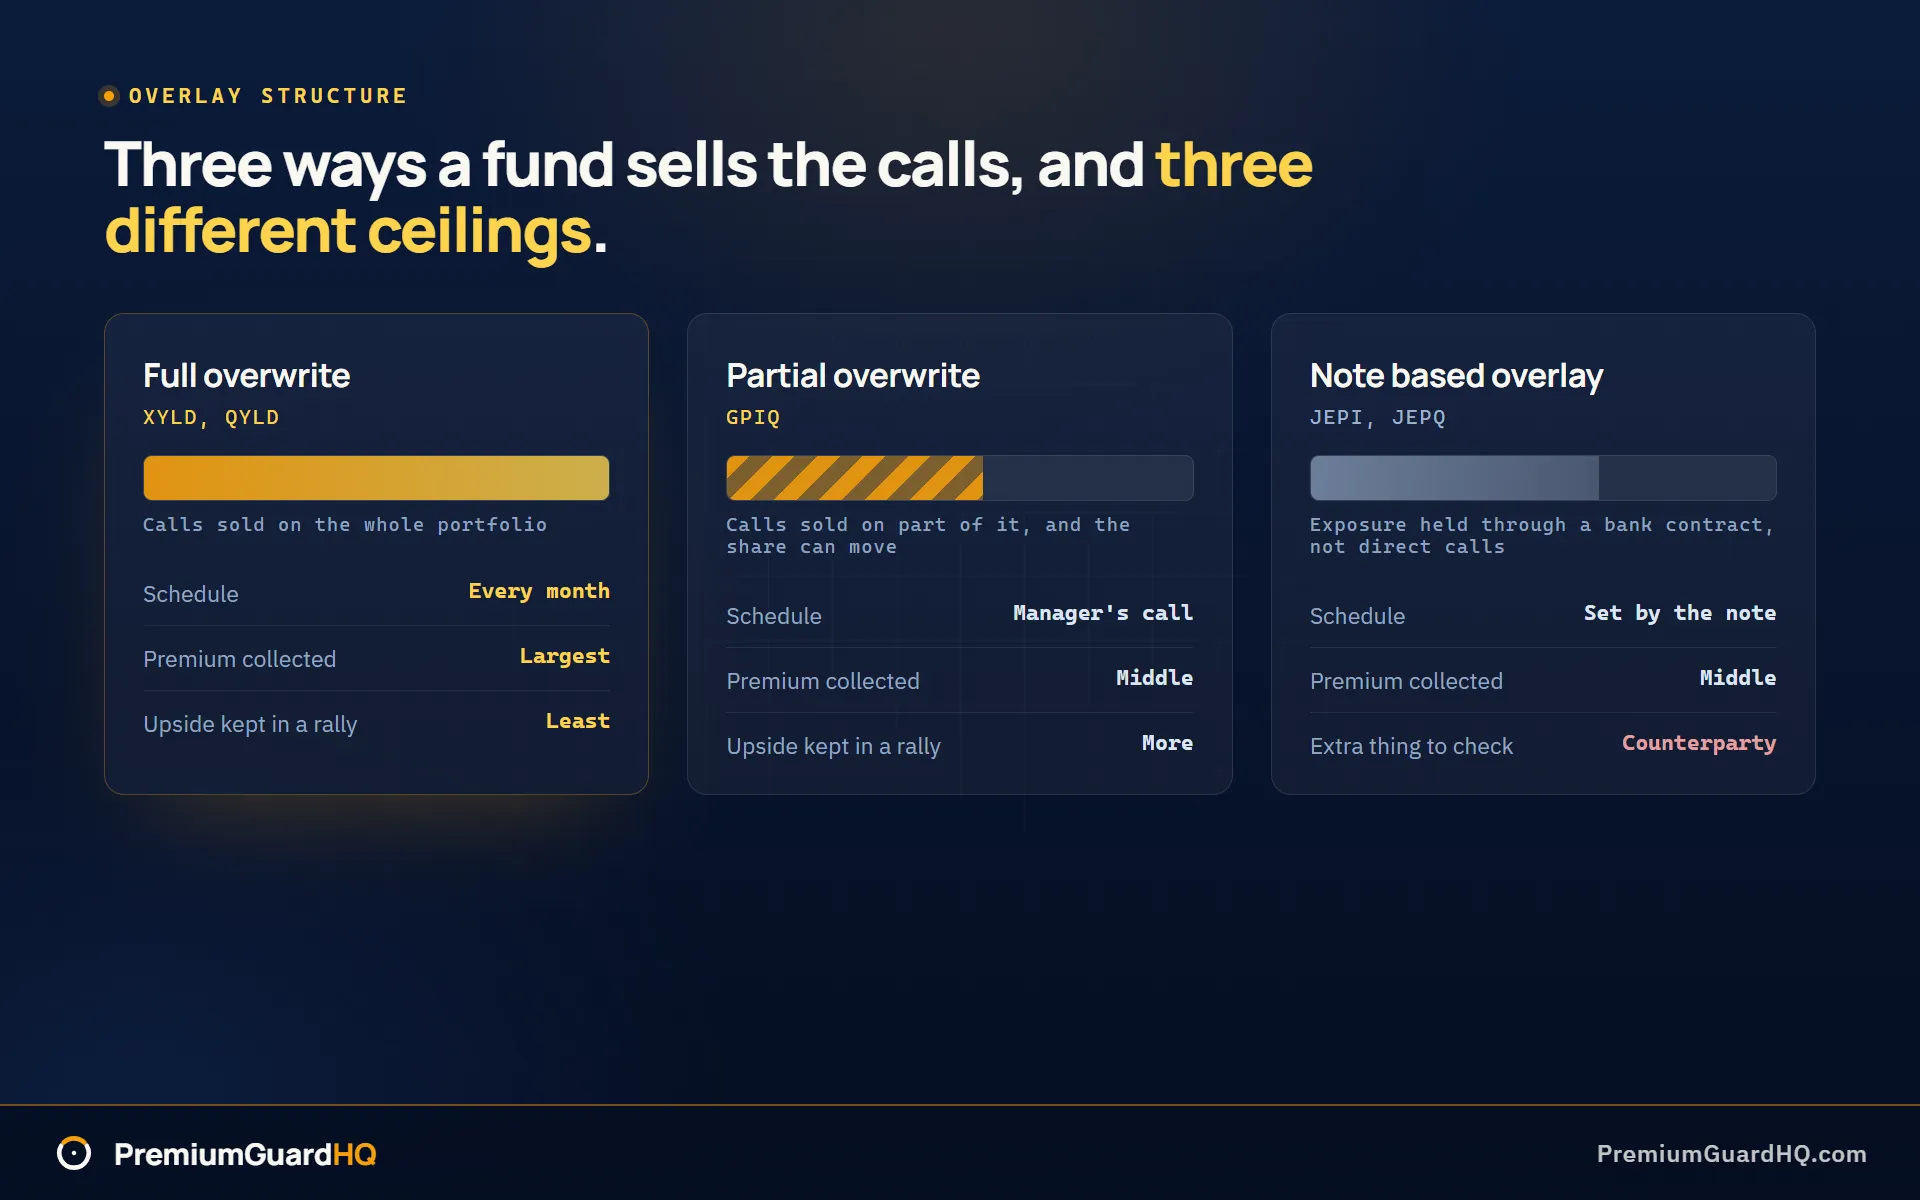
Overlay structure. An overlay is the method a fund uses to sell call options against its holdings. Some funds sell calls on the whole portfolio every month. That is called a full overwrite. XYLD and QYLD work this way. Others sell calls on only part of the portfolio, or vary how much they write from month to month. That is a partial overwrite. GPIQ works this way. A few funds use note based overlays instead of selling options directly. JEPI and JEPQ do this. Each structure caps your upside in a different way, and the quickest way to feel the difference is to run one covered call through a calculator and watch where the ceiling lands.
Distribution makeup. A distribution is the money a fund pays out to you. That payout can be ordinary income, qualified dividends, capital gains, or return of capital. Return of capital means the money is paid out of the fund’s own assets rather than income its investments earned. Each type gets taxed differently. You cannot tell which one you are getting just by looking at the yield number.
The 5 checks to run before you buy
- Check the expense ratio. This is the yearly fee the fund charges you. Confirm the number on the fund’s own site. Write down the date you checked it. Fees change less often than distributions, but never assume a number in an old article is still current.
- Check size and tradability. Look at three things: assets under management, which is the total money invested in the fund, daily trading volume, and the bid-ask spread. The bid-ask spread is the gap between the buying price and the selling price. A fund can look good on paper and still trade poorly if too few shares change hands each day.
- Compare SEC yield to the trailing distribution. SEC yield is a standardized estimate based on the fund’s recent income. The trailing distribution rate simply adds up the last twelve months of actual payouts. These two numbers can tell very different stories. Know which one you are looking at before you compare funds.
- Look up the distribution classification. Pull the fund’s own notices and see if any part of the payout was marked return of capital. That one label changes what the “yield” number actually means for you.
- Decide where it should live. Choose between a taxable account and a retirement account with different tax rules. The right choice depends on how the fund’s payouts get classified. Check with a tax professional before you assume how a specific fund will be taxed in your situation.
This roundup is the shortlist. It covers six real products, vetted on structure. It does not answer a different question some readers are actually asking: whether to buy a fund like these at all, or run covered calls yourself. That comparison deserves its own article. Read that one for the decision. Use this one for the shortlist.
Frequently asked questions
Are covered call ETFs fixed income?
No. Covered call ETFs hold stocks and sell call options against them. A call option is a promise to sell a stock at a set price by a set date. That is an equity strategy, not a bond strategy. Bonds pay you back a fixed amount on a fixed schedule. Covered call ETFs do not work that way. The option premium can soften a stock drop a little, but it does not stop one. If the stocks in the fund fall hard, your account value falls too. Treating these funds like a bond substitute is one of the most common and costly mistakes new buyers make.
Why did my covered call ETF distribution drop this month?
Most likely, implied volatility fell. Implied volatility measures how much the market expects a stock to swing. When that expectation drops, the call options a fund sells bring in less cash, so the next payout shrinks. This is normal, not a sign something is broken. Some funds also pay out lumpy capital gains once or twice a year on top of their regular schedule. That makes the payout history look choppy even when the fund is running exactly as designed.
Does Vanguard have a covered call ETF?
No. Vanguard does not currently offer a dedicated covered call ETF. If you want this kind of income strategy, you have two paths. Pick a fund from a firm that already runs one, like the ones covered here. Or build it yourself: hold a Vanguard index ETF and sell listed call options against it yourself. That second path takes more work and more knowledge of options, but it gives you full control over the strike price and timing instead of accepting a fund manager’s choices.
What is return of capital and how do I tell if it’s destructive?
Return of capital is a payout made from your own invested money, not from profit the fund earned. Every fund handles this differently, so check the fund’s year-end tax breakdown and its official distribution notices to find out how a specific payout was classified. Return of capital by itself does not mean anything is wrong. Plenty of funds return some capital by design. The real warning sign is return of capital showing up alongside a steadily falling share price, the fund’s actual value per share, over multiple years. That combination means your principal is shrinking while you are told you are earning income.