
Suppose you hold 100 shares in a stock. You sell one call option on that position. The buyer of the call gets the right to purchase your shares at an agreed price, called the strike. You receive money right away for selling the call. That payment is the premium.
Next, you see a covered call payoff diagram. The chart draws a kinked line that plots your profit or loss at the option’s end date, known as expiration. You hesitate. Where does the line cross breakeven, the stock price at which your loss turns to zero? Where does it level off and cap your gain? What is the true maximum loss?
Many traders can describe how a covered call works. Very few can read the payoff chart a short while later. This page closes that gap.
When you finish, you will be able to draw the diagram from memory by combining your stock position and the call you sold. You will pick out breakeven, peak profit, and worst loss directly from the line. You will not need to work through formulas first.
This page has a narrow scope: it explains only the chart’s shape at expiration. If you want the trade’s pros, cons, and risk discussion, read the covered call risk breakdown. On this page, the goal is visual recognition of the payoff pattern.
What is a covered call payoff diagram
A covered call payoff diagram plots your profit or loss on option expiration across many possible stock prices. The horizontal axis lists the stock price. The vertical axis measures profit or loss. The line climbs as the stock rises, then turns flat at the strike, and the premium you collected upfront shifts breakeven below your original cost.
Two conventions keep these charts useful. Most diagrams display numbers per share, not per contract. A single options contract represents 100 shares, so multiply any per share figure by 100 to get the true dollar outcome. Unless the chart says “today” or “T+0,” treat it as an expiration payoff. Such a chart uses the option’s final value, with all time value already gone.
How to read the axes and shape of a covered call payoff chart
You need to understand both axes before any payoff numbers will make sense.
The horizontal axis shows the stock price at expiration. You may see it written as S_T, which stands for the stock’s price on the option’s end date. A useful chart spans a wide range on this axis, from well below your purchase price up through and beyond the strike. The strike is the agreed sale price for your shares if the option gets exercised against you.
The vertical axis tracks your profit or loss. A flat line through the middle represents zero. Above that line you have a gain. Below it you have a loss.
Time to examine the shape. For stock prices below the strike, the line climbs at the same slope as the stock itself. You still own the shares, so every $1 move in the stock changes your P/L by $1. The entire line sits above a pure stock position because the premium you collected raises it. Premium is the upfront cash you received for selling the call, split between intrinsic value and extrinsic value.
At the strike price, the line bends sharply. That bend is the kink. Above the strike the line runs flat. Your upside ends at that level because you already committed to sell the shares at that price, so any further gain goes to the call buyer, not to you.
Figure 1 displays exactly that shape with markers for the strike, breakeven, the flat amber-gold profit plateau, and the red loss zone on a navy and cream background.
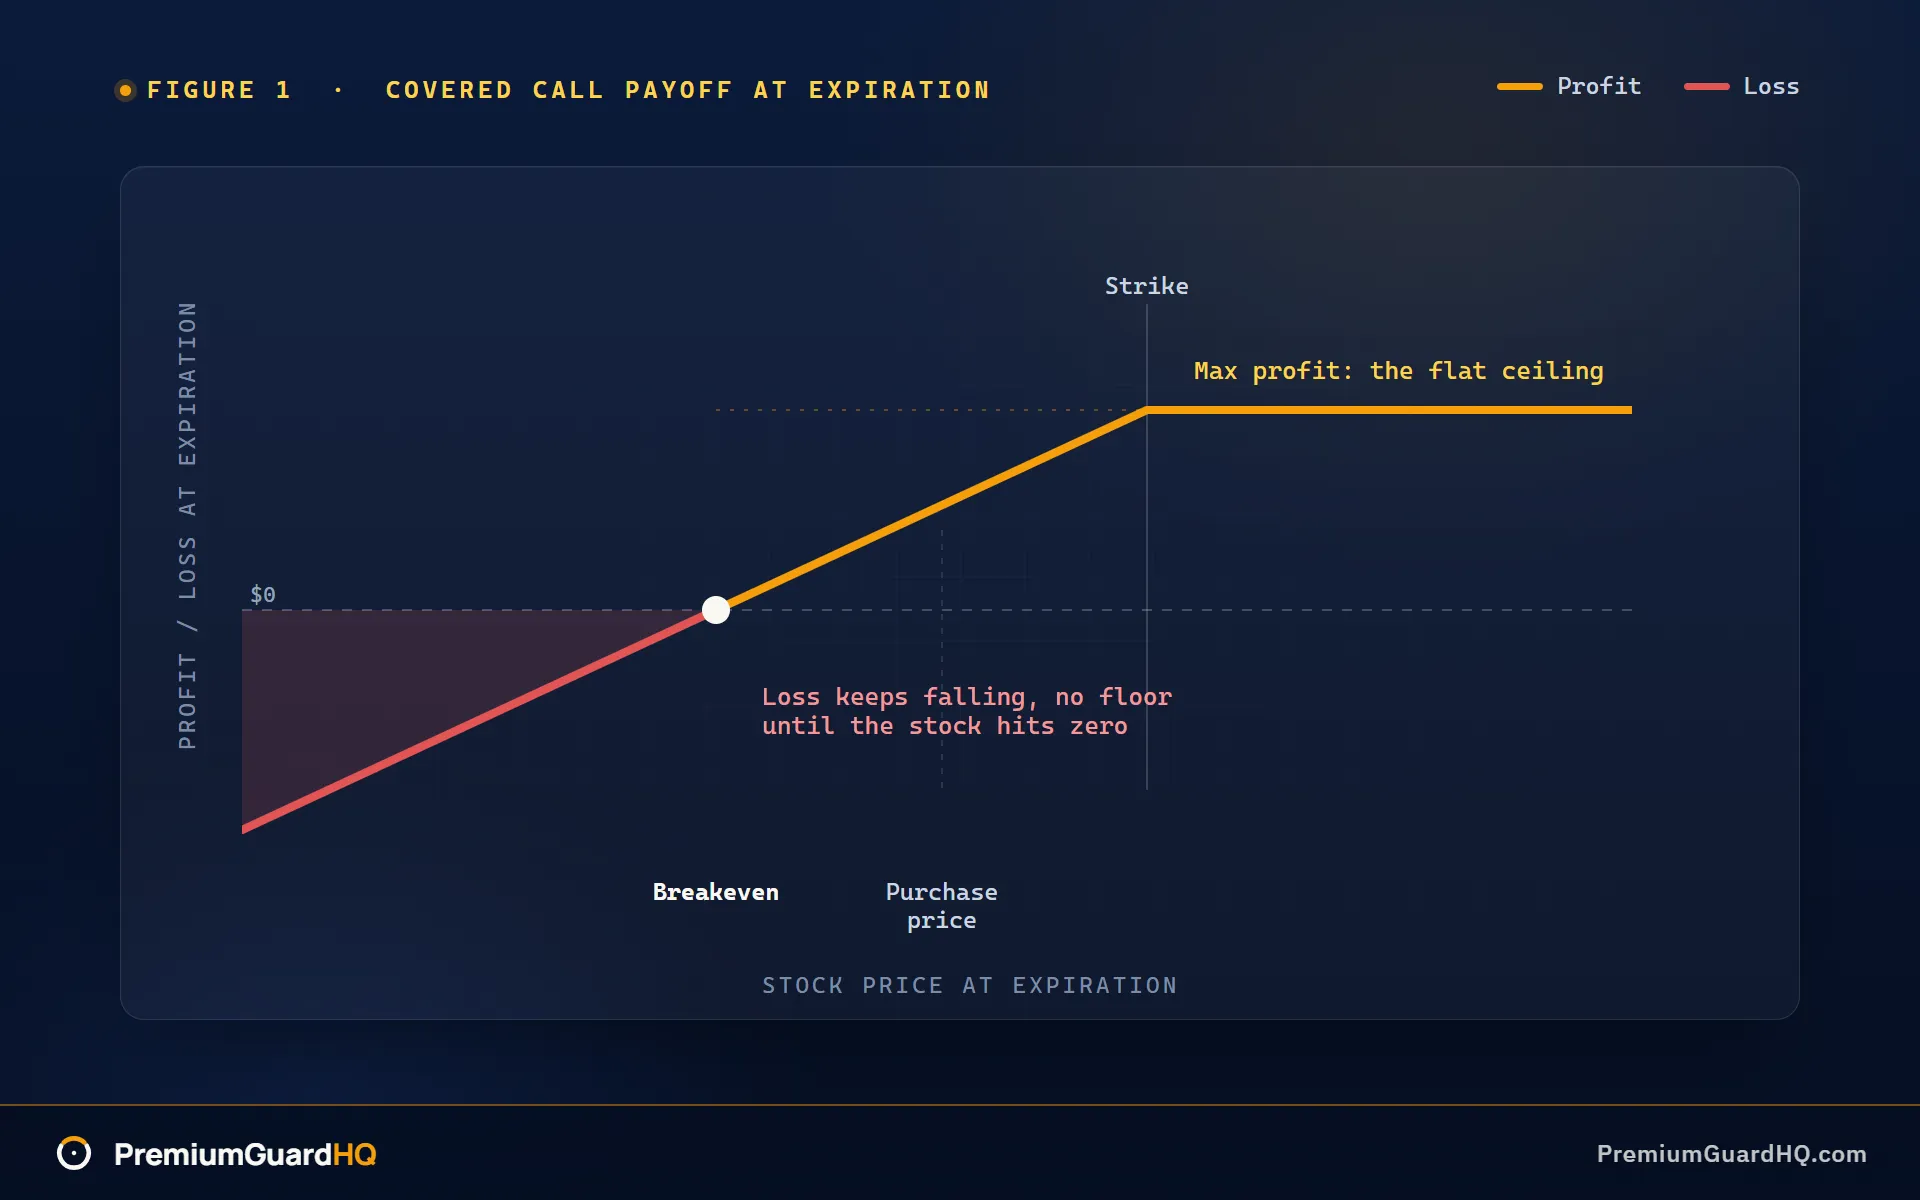
One additional note: if your broker’s P/L curve appears rounded rather than sharply bent, you are looking at a different chart. That curve shows today’s estimated value, including remaining time value. It is not the expiration payoff that Figure 1 presents.
How to build a covered call payoff diagram from its two parts
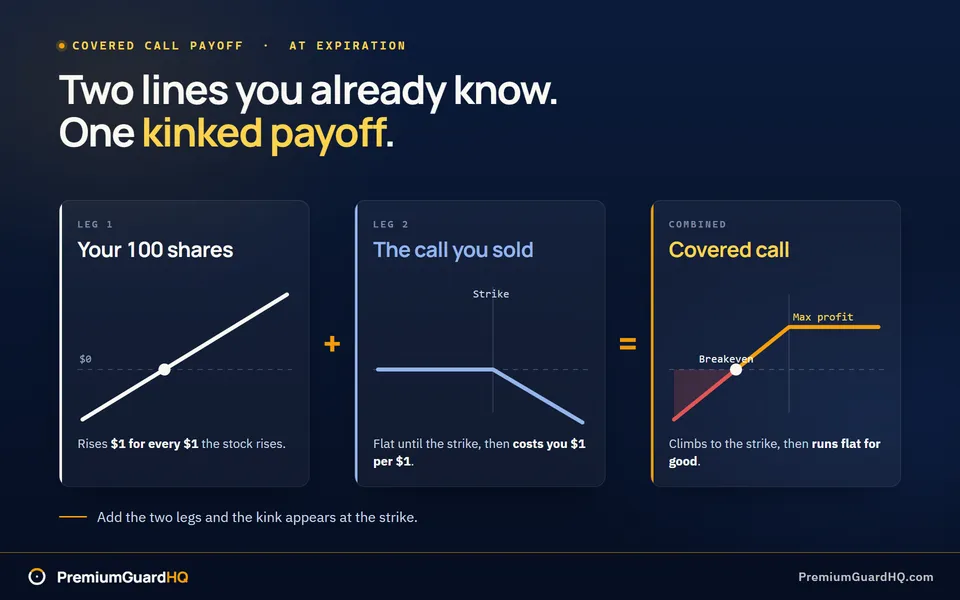
A covered call combines stock ownership with selling a call option on that stock. A call option gives the buyer the right to purchase your shares at a predetermined price. The fastest way to sketch the diagram yourself is to build it from two separate parts and then add them.
We are drawing the diagram at expiration, the day the option contract ends. Only the option’s final value matters here, with no time value remaining. Leave trading fees and dividends out for now. You can fold them in later as minor adjustments after the basic shape becomes clear.
Leg 1: your stock. This piece is straightforward. For every additional dollar the stock rises, your P/L also rises one dollar. Draw a straight line sloping upward to the right. Place a mark where the stock price equals your purchase price. At that point your P/L is zero. That mark becomes your anchor.
Leg 2: the call you sold. This piece changes direction. The strike is the price you accepted to sell your stock. For stock prices below the strike, the call expires worthless, so the buyer will not exercise it and you owe nothing. This leg’s payoff stays flat at zero. Once the stock rises above the strike, you owe the difference. Each $1 move above the strike costs you $1 on this leg. Draw a line at zero up to the strike, then a downward line after that.
Now combine the two lines at each stock price.
Below the strike, the stock leg climbs while the call leg remains flat at zero. Adding them gives you the stock line shifted upward by the premium. The premium is the cash you received when you sold the call. The slope stays the same, but the line starts higher.
Above the strike, a key change occurs. Your stock leg still rises $1 per $1 gain. Your short call leg now falls $1 per $1 gain. Two lines with equal and opposite slopes cancel each other completely.
The short call erases every additional dollar of stock gain above the strike. That is why the combined line flattens there.
Before you add anything else to the chart, mark the strike price. That is the single point where the diagram switches from rising to flat. Once you have marked that line, locating breakeven and max profit becomes much simpler.
How to read breakeven, maximum profit, and maximum loss from the finished chart
After the lines are drawn, you can skip the math at first. Just look at the chart. It hands you three numbers if you know where to look.
Breakeven. Breakeven is the stock price at which your loss ends and your position breaks even. Find where the payoff line crosses the horizontal zero line, the divider between profit and loss. That intersection is your breakeven. It always lands below your purchase price because the premium you collected lifts the whole line. That premium is the cash you got for selling the call. The cushion lets the stock fall a little and you still break even. Refer to this figure as breakeven at expiration, since the chart shows only that date.
A formula check confirms the number: breakeven equals your stock purchase price minus the premium per share.
Maximum profit. Look at the flat ceiling on the chart’s right side. Once the line levels off at or above the strike, its height above zero is your maximum profit per share. The strike is the price you agreed to sell your shares for if the option is exercised against you.
Formula check: maximum profit equals the strike price minus your stock purchase price, plus the premium.
You can also think of it this way. The strike plus the premium is your effective selling price. That is the total amount per share you would receive if your shares were sold at the strike. The flat line on the chart simply extends that number across every stock price above the strike.
Maximum loss. People often rush past this part. Trace the line leftward toward lower stock prices. It falls without stopping. The chart shows no floor until the stock price reaches zero.
Formula check: when the stock price is zero, your loss equals your stock purchase price minus the premium. That is the worst case the chart displays, before commissions.
| Metric | Where to look on the chart | Formula (per share) |
|---|---|---|
| Breakeven | Where the line crosses zero | Stock price paid minus premium |
| Max profit | Height of the flat plateau | (Strike minus stock price paid) plus premium |
| Max loss | Line’s value at stock price = 0 | Stock price paid minus premium |
Whether you are comfortable holding that downside is a separate decision. The covered call risk breakdown addresses that question fully.
Worked example: draw the covered call payoff chart and label the key points
Here is a hypothetical trade with round numbers, meant only to illustrate the chart’s shape.
The setup. You purchase 100 shares at $50.00 per share. You sell one call option that has a strike price of $55.00. That strike is the price at which you agree to sell your shares if the option is exercised. You receive $2.00 per share up front for selling the call. That cash is the premium. Leave out trading fees and taxes to keep the arithmetic simple.
Step A: the three key numbers, per share.
Breakeven equals your stock cost minus the premium. $50.00 minus $2.00 comes to $48.00. If the stock closes below that level, you are losing money.
Maximum profit is the distance from the strike to your purchase price, plus the premium. ($55.00 minus $50.00) plus $2.00 gives you $7.00. That is the upper limit no matter how far the stock rises.
Maximum loss occurs if the stock price drops to zero. It equals your stock cost minus the premium: $50.00 minus $2.00 is $48.00. That is the worst outcome the chart displays.
Step B: see it on the chart.
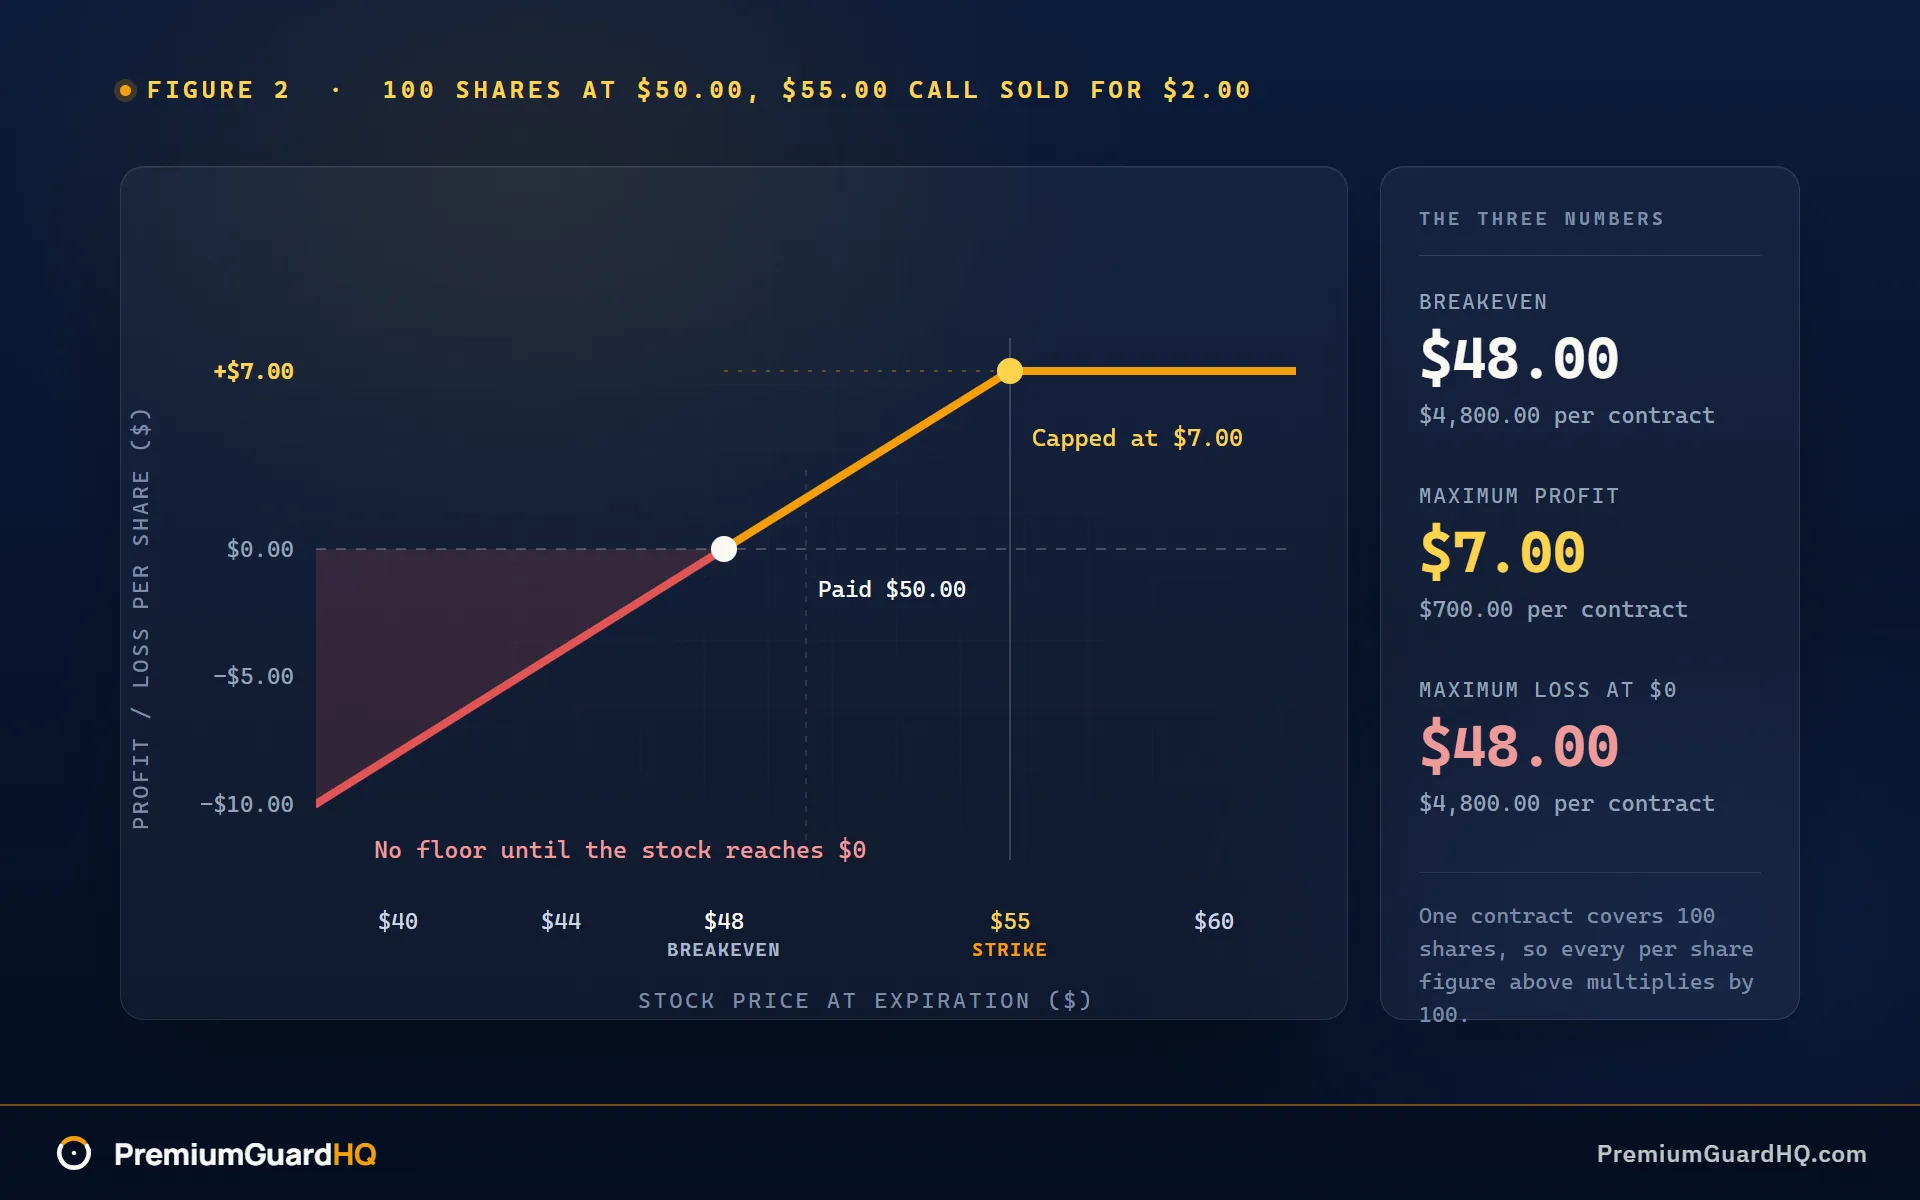
Figure 2 illustrates this trade. The horizontal axis is labeled “Stock price at expiration ($).” The vertical axis is labeled “Profit/Loss at expiration ($ per share).” One marker appears at $55, the strike, exactly where the line bends. Another marker appears at $48, breakeven, exactly where the line crosses zero. Above $55 the line levels off at $7, shown in amber-gold. Below $48 the line continues downward into red, with no floor until the stock price reaches zero.
Step C: the numbers in one place.
| Metric | Per share | Per contract (100 shares) |
|---|---|---|
| Breakeven | $48.00 | $4,800.00 |
| Maximum profit | $7.00 | $700.00 |
| Maximum loss (at $0) | $48.00 | $4,800.00 |
A single contract represents 100 shares. Multiply each per share number by 100 to find your actual dollar outcome. This trade limits your gain to $700, provides a $200 buffer before losses begin, and still exposes you to large losses if the stock falls hard. You can plot the same three numbers for another strike without redrawing the chart by hand.
Frequently asked questions
Why is my broker’s covered call P/L graph curved instead of flat above the strike?
Your broker likely displays today’s value rather than the value at expiration. That display is sometimes labeled “T+0,” meaning today with zero days to go. Before expiration, the call you sold still carries time value, so the curve appears rounded instead of sharply bent. In your platform’s strategy tool, find a setting or toggle marked “expiration.” Selecting it will produce the sharp kink shown in Figure 1.
Is the covered call breakeven just my stock cost basis minus premium?
For the clean textbook version of the chart, that is exactly correct. Cost basis means the amount you paid per share. In a real account, a few small items can shift that figure. Broker commissions and dividends received while holding the stock can alter your actual breakeven slightly. The diagram shows the core calculation. Your account statement shows the final adjusted number.
Where do I see the “effective selling price” on the payoff diagram?
It is the height of the flat plateau above the strike. Add the strike and the premium you received. That sum is the effective price per share you would walk away with if your shares were sold. The flat line in Figure 1 and Figure 2 simply draws that number across every stock price above the strike marker.
Is maximum loss limited in a covered call?
No. The chart shows the loss increasing as the stock falls, with no floor until the stock reaches zero. The premium you collected softens the decline but does not stop it. A covered call reduces your cost only slightly. It does not shield you from a large drop in the stock price. For a complete look at what limits your risk and what does not, read the covered call risk breakdown.