
Open any options screener and sort by annualized return. You will see the same thing every time. The names at the top are usually junk.
A cash secured put screener search always turns up the same trap. A cash-secured put is a promise to buy 100 shares of a stock at a set price, called the strike price, if the stock falls below it. You set aside cash to cover that promise, which is why it is called “cash-secured.” The stocks with the fattest premiums, meaning the most cash you collect upfront, are usually the ones nobody should want to own for six months.
So you start hunting for “highest yield.” You end up holding a stock you would never buy with your own cash, just because a screener said the strike looked cheap.
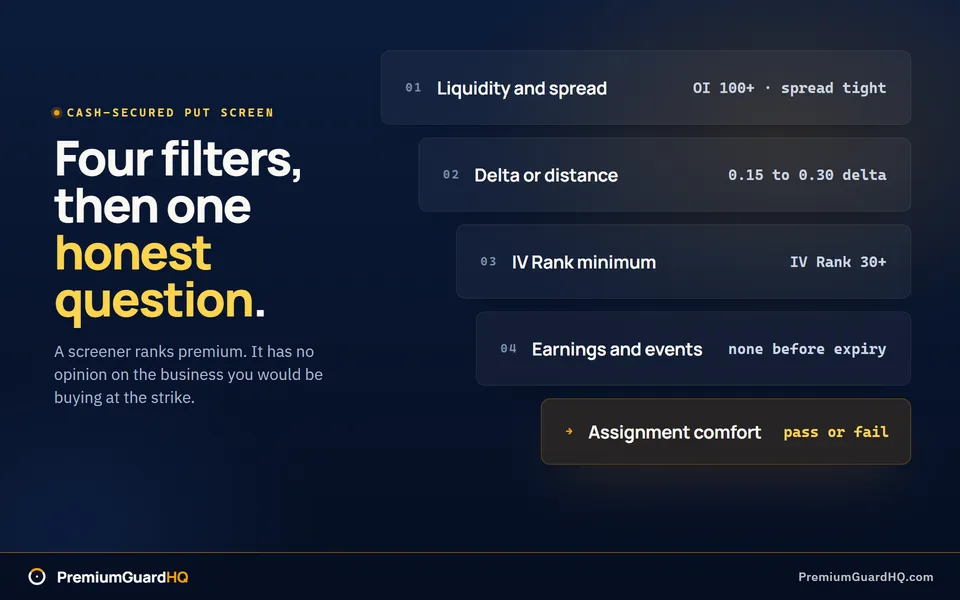
This guide fixes that. Below is a 4-filter screen that turns a messy watchlist into a short list of liquid, ownable contracts. Liquid means the options trade often enough that you can get in and out at a fair price. After the filters, you will run one final gut-check before you sell anything.
You only need free tools: your broker’s option chain, a Barchart-style options screener, and any earnings calendar. PremiumGuardHQ does not screen stocks for you. It tracks and reconciles the puts you have already sold. So think of this guide as the process you run before you open PGHQ, not something you do inside it.
Before Step 1, here is what to line up first.
Before you start: pick your tools and set your baseline
You need a few things open before step 1.
An options data view. Your broker’s option chain works fine. So does a free web screener like Barchart. Either way, it needs to show five things:
- Bid/ask price
- Volume
- Open interest (how many contracts are still open)
- Delta (a number that estimates how likely the option finishes in the money, meaning the stock price is beyond the strike price)
- Implied volatility (the market’s guess at how much the stock will swing)
An earnings calendar. Keep this open in another tab. Also note any big known events coming up, like an FDA drug decision or a lawsuit ruling, for stocks you already track closely.
A baseline time window. Set your screen to show contracts with 30 to 45 days to expiration. This is often written as DTE, which just means “days till expiration.” You can narrow this range later once you have more experience. For now, use one fixed window so every stock you compare sits on the same clock.
A shortlist sheet. Open a blank spreadsheet or notes doc. Add these columns: ticker, expiration, strike, bid or credit, delta, IV Rank, volume and open interest, bid-ask spread, earnings date, and a pass or fail column for “assignment comfort.” That last column matters most. It asks whether you’d actually be fine owning the stock if the put gets assigned to you, meaning you’re forced to buy the shares at the strike price. If you are new to the mechanics, start with what a cash-secured put actually commits you to.
With those four things ready, you can run the first filter.
Step 1: enforce liquidity and a tight bid-ask spread
Skip this filter and you can pick the right stock and the right strike and still lose money on the fill. Liquidity means how easy it is to buy or sell something without moving the price. Bad liquidity quietly eats your profit before the trade even starts.
Start with your normal universe. This means optionable U.S. stocks and ETFs in your price range, the same ones you already screen for value or growth. “Optionable” just means the stock has options you can trade on it. Now apply two checks at the contract level, not the stock level. A contract is one specific option, tied to one strike price and one expiration date. A stock can be great and still have a bad options market.
Check 1: Open interest. Open interest is the number of contracts still open right now, meaning trades that have not closed yet. Use 100 or more as your starting minimum. Below that, you may struggle to find someone on the other side of your trade later, when you want to sell or exit.
Check 2: Volume. Volume is how many contracts traded today. Avoid strikes showing “0” for the day whenever you can. A strike is the set price at which you agree to buy the stock if assigned. Zero volume on a strike means nobody is actively trading it right now, even if the open interest number looks fine. These two columns answer different questions, and how open interest and volume differ on a chain is worth understanding before you lean on either one.
Pick expirations and strikes where several contracts near your target delta are all trading. Delta is a number that roughly shows the odds an option will expire in the money. Active trading near your target delta tells you the market is really working at that price, not just sitting there untouched.
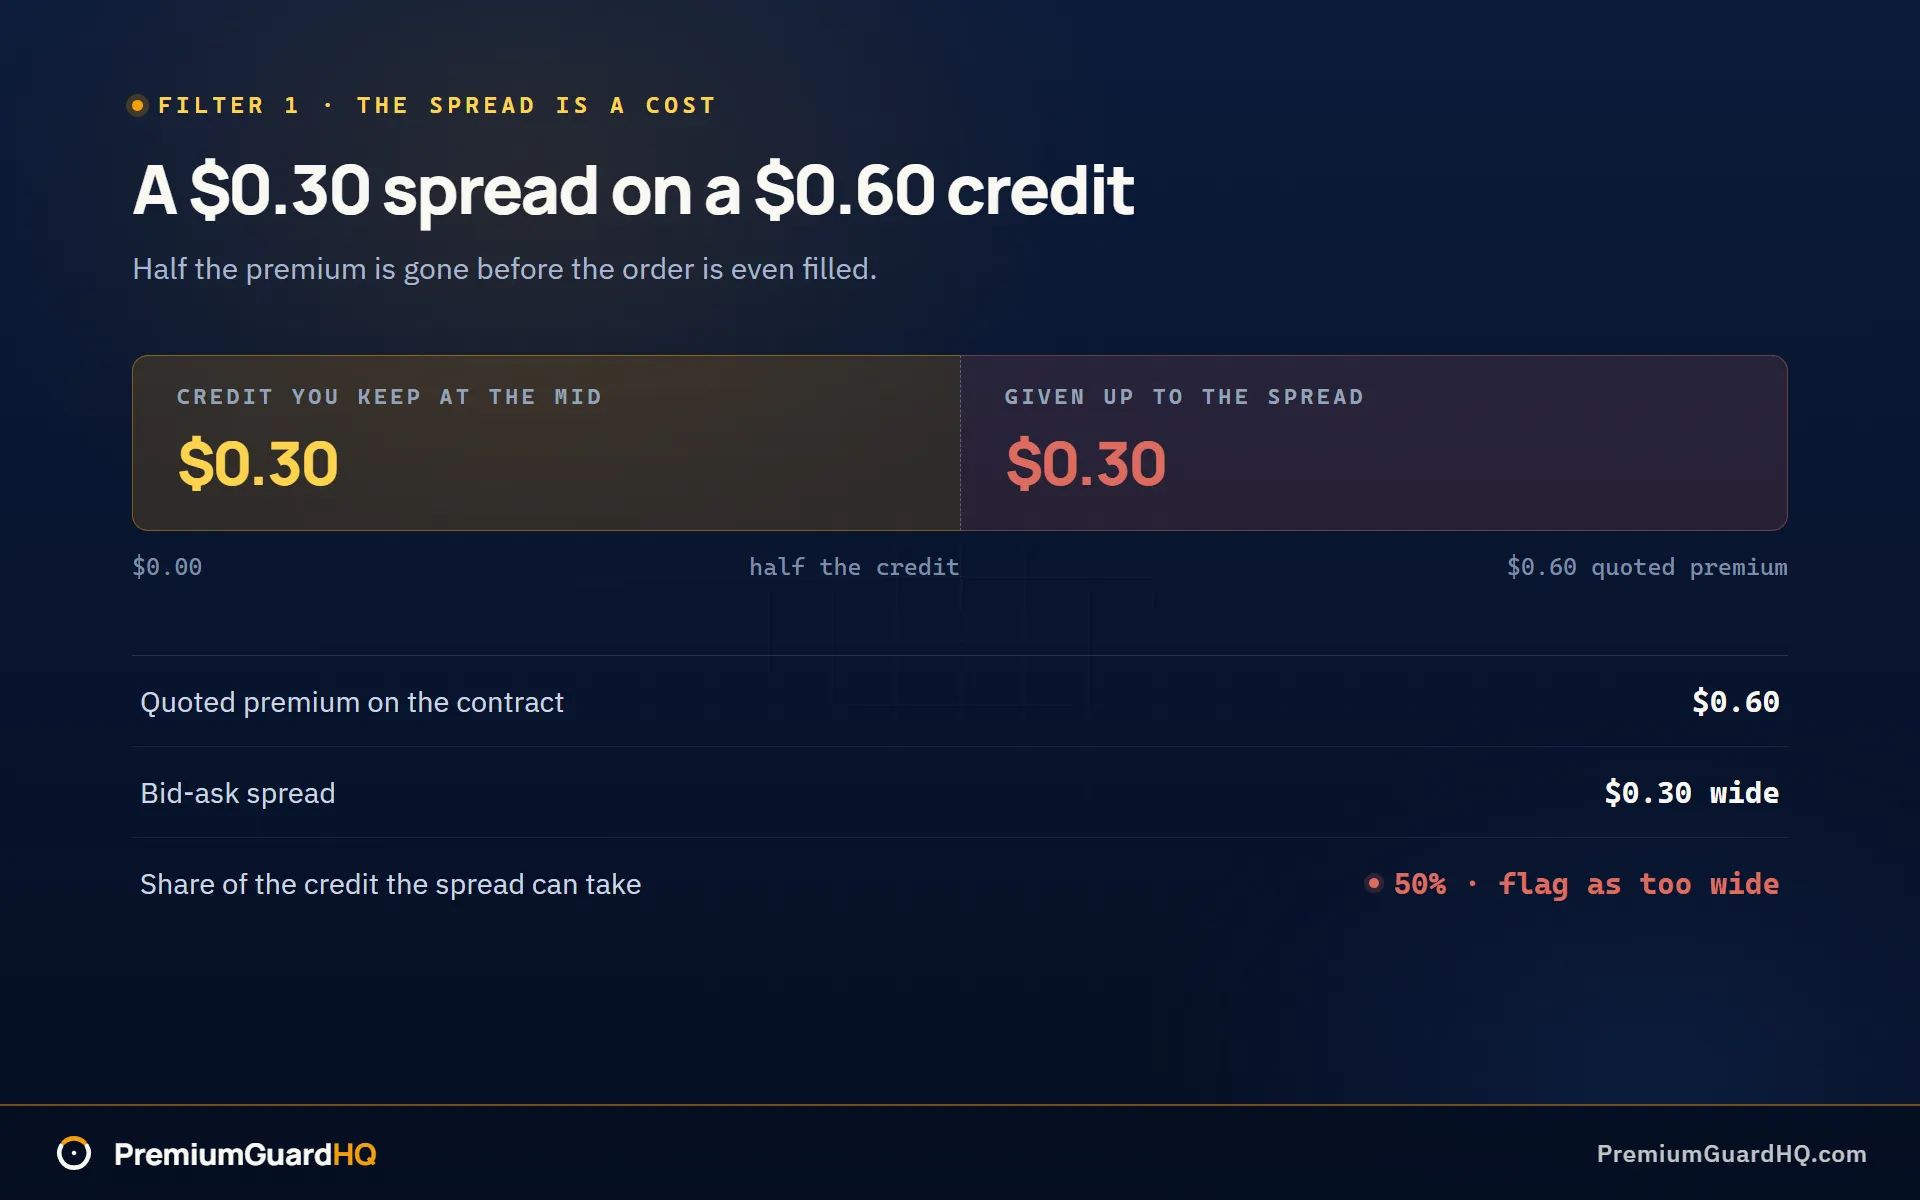
Next, run the spread check. Look at the bid and the ask. The bid is the highest price a buyer will pay right now. The ask is the lowest price a seller will take. The gap between them is the bid-ask spread, and it’s a hidden cost. If you want the plain definition, here is how the bid and ask set the price you actually get. Ask yourself one plain question: if I place a limit order near the middle of that spread, does the spread still eat up a big chunk of my credit? Credit is the cash you collect for selling the option. If the spread is $0.30 wide on a contract paying $0.60 in premium, half your income is gone before you even get filled. Flag that contract as too wide and move on.
One exception applies. If a ticker you already like only has one decent strike that clears your other checks, let it pass even if it looks a bit thin. Don’t widen your whole stock list just to avoid one thin strike.
Log every survivor in your shortlist sheet. Record the ticker, expiration date, strike, bid and ask, volume, and open interest for each one.
You should now have a shorter list of put contracts. On this list, open interest and volume clear your minimums, and the bid-ask spread is tight enough that a limit order near the middle would not eat up most of your premium.
Step 2: filter by delta or distance out of the money
You now have a clean list of liquid contracts from Step 1. Liquid means the option trades often enough that you can get in and out at a fair price. This next filter answers a different question: how close to the current stock price are you willing to sell your put?
Pick one measurement for this entire screen. Do not switch back and forth between tickers.
Option A: Use delta
Delta is a number between 0 and 1 that you already added to your data view in the setup step. It roughly estimates the odds that an option finishes in the money. For a cash-secured put, that means the stock price ends up below your strike price and you get assigned the shares. Assigned means you are required to buy 100 shares of stock at your strike price.
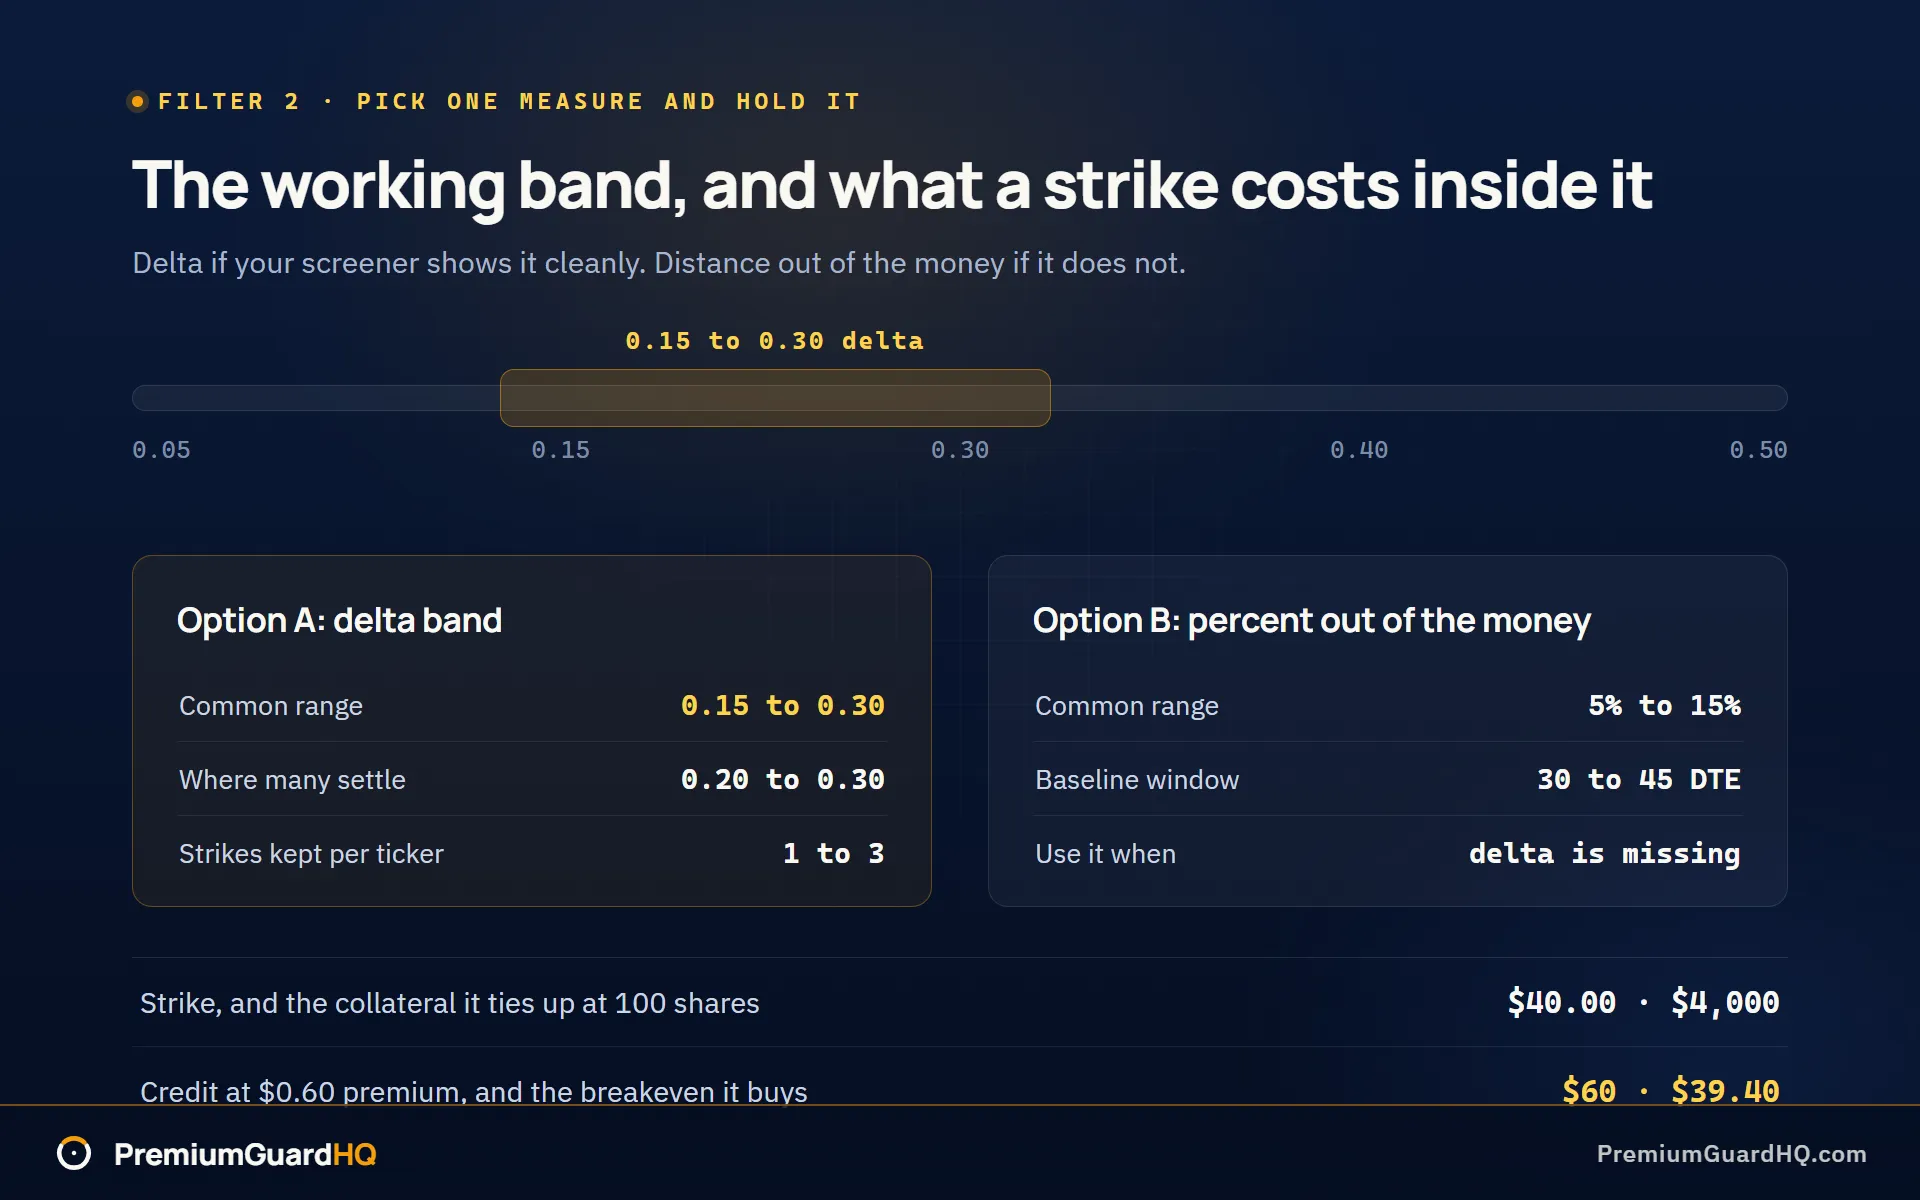
Most traders who sell cash-secured puts use a delta between 0.15 and 0.30. Many settle around 0.20 to 0.30. A lower delta, like 0.15, sits further from the stock price and pays a smaller premium. Premium is the cash you collect upfront for selling the put. A higher delta, like 0.30, sits closer to the stock price and pays more, but assignment becomes more likely too.
Option B: Use percent out of the money
If your tool does not show delta cleanly, use distance out of the money instead. This is the percent gap between the current stock price and the strike price. A common range is 5% to 15% out of the money. The right number depends on the stock and how many days are left until the option expires. Use this option only when delta is missing or looks unreliable on your screener.
Apply the filter
Work through your list from Step 1:
- Remove any contract outside your delta band, or below your minimum percent out of the money.
- For each contract that survives, multiply the strike price by 100. This tells you the cash you need to set aside per contract. It is also roughly what “getting assigned at that price” costs you in stock.
Check the numbers against the stock
- Write the current stock price next to the strike price, so you can see the gap at a glance.
- If your tool shows breakeven, record that too. Breakeven is the strike price minus the credit you collected. The stock needs to stay above this price for you to avoid a loss, even if you get assigned.
Keep the list narrow
For each ticker, keep only 1 to 3 strikes that land inside your band. If ten strikes all technically qualify, your band is too loose. That is not a reason to save all ten “just in case.” Fewer choices here means fewer decisions later.
You should now have, for each ticker on your list, 1 to 3 candidate put contracts. Each one sits inside your delta band or your minimum distance out of the money, with strike price, breakeven, and dollar collateral requirement written down next to it.
Step 3: require a minimum IV Rank so you get paid for the risk
You now have a list of strikes for each stock. Each one fits your delta range. Delta measures how likely an option is to finish in the money. This step checks something new. Is the payment you get for selling the option, called the premium, actually a good deal? Or is it just a normal payment that looks better than it is?
Add a new column to your sheet called IV Rank. First, here is what IV means. Implied volatility, or IV, is the market’s guess at how much a stock price will move. IV Rank compares today’s IV to that same stock’s IV over the past year. A stock that always moves a lot will always show a high IV number. IV Rank fixes this problem. It compares the stock to its own history, not to other stocks. If you want the longer version, here is how IV rank is measured against a stock’s own year.
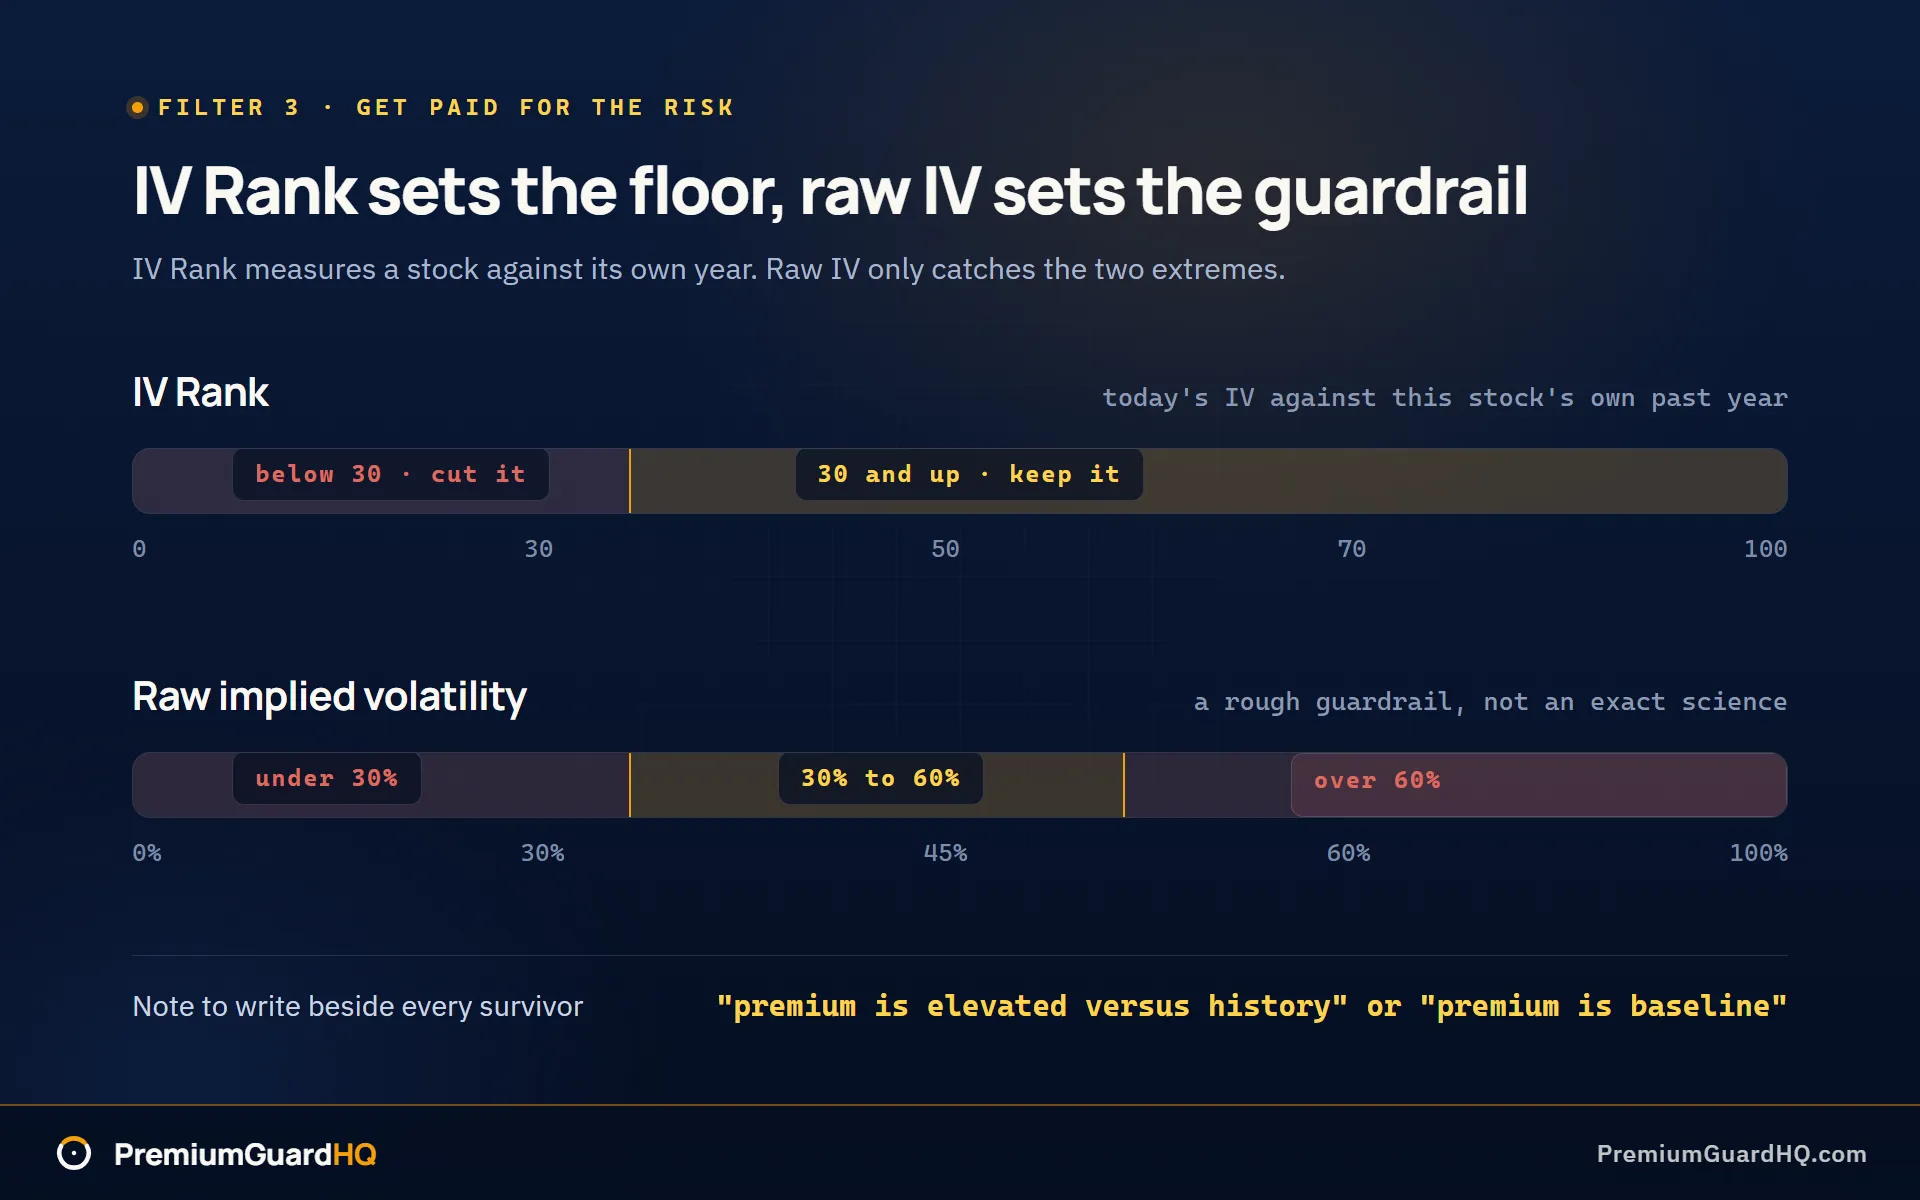
Set your minimum at IV Rank 30 or higher. If your screener shows IV percentile instead, use that same number as your cutoff. Below 30, you are usually selling the option cheap compared to that stock’s own history. This is true even if the premium looks fine next to other stocks.
Think of this as a rule that makes sure you get paid for the risk you take. It does not predict what the stock will do next. A high IV Rank does not mean the stock will fall. It means you are getting a fair payment for agreeing to buy the stock if it does.
Some tools also show a plain IV number, not just IV Rank. If yours does, add one more rough check. Many traders use a range of 30% to 60% IV as a guardrail. Below that range, the premium is often too small to bother with. Above it, you are usually looking at a stock with a big event coming up, or a wild meme stock. Both are the kind of risky trade this guide helps you avoid. Do not treat this range as an exact science. It only catches the two extremes.
Now apply both checks to your list from Step 2:
- Remove any contract with an IV Rank below 30. Do this even if the yearly return looks good on paper. A big return next to a low IV Rank usually just means the stock is cheap compared to its own history, not that it’s a good trade.
- If you’re also using the 30% to 60% IV range, remove anything far outside it unless you have a clear reason to keep it.
For each contract that survives, write down its IV and IV Rank in your shortlist sheet. Then add one short note: “Premium is elevated versus history” or “Premium is baseline.” You’ll thank yourself for this note later, when you’re comparing many stocks and can’t remember why one made your list.
One thing this step cannot do is tell you if the company behind the stock is one you actually want to own. A screener can only rank premiums. It has no opinion on the business itself. That decision comes next, in Step 4, where you run the assignment-comfort test.
You should now have a shortlist where every contract clears your IV Rank minimum. Each one has its IV, IV Rank, and a short note written next to it, so you can see at a glance which stocks pay a rich premium and which pay a normal one.
Step 4: run the earnings and event check, then pass the assignment-comfort test
Your list from Step 3 only looks at price and payment. It does not know that an earnings report could blow up the trade overnight. Earnings are a company’s scheduled announcement of how much money it made. This step catches that risk. It is also the one step no screener can do for you.
Check earnings first. For every ticker still on your list, look up the next scheduled earnings date. If your expiration date falls after that earnings date, remove the contract. A cash-secured put means you set aside cash to buy 100 shares if the stock drops below your strike price. That cash gives you no protection against a big overnight price jump from an earnings surprise. The one exception is if you are deliberately trading around earnings on purpose, which is a riskier plan this guide does not cover. If earnings falls inside your 30 to 45 day window but before your expiration date, that is fine. Just write the earnings date on your shortlist sheet so you do not forget it.
Check other events too. Look for an ex-dividend date. This is the date that decides who gets the next dividend payment. Skip the ticker if that date falls inside your option’s window and you want to avoid the extra pricing noise it can cause. Also scan for any big known event the market is already watching, like a regulatory ruling or a drug trial result. Keep this list short. You are not trying to guess the news. You are just avoiding contracts that cross a date everyone already knows about.
Now run the assignment-comfort test. Assignment means the stock drops below your strike price and you are required to buy 100 shares at that price. It is worth being precise about what assignment obligates you to do before you treat it as a footnote. This test is what separates a good screener from good judgment. For every ticker still standing, write this exact sentence and fill in the blank: “If assigned, we own 100 shares at $X.” Put your strike price where the X is. Then ask two honest questions:
- Would owning 100 shares of this stock, at this price, still fit your overall plan and your rules about how much of one stock you are willing to hold?
- If the stock kept falling after you got assigned, would you be willing to hold it for months?
If your honest answer is “no” or even “maybe,” mark that contract as a fail and cross it off your list. Do this even if it shows the best return on your sheet. A great return on a stock you do not actually want to own is not a good trade. For more on what assignment really means inside a full income cycle, see our guide to what the whole wheel cycle looks like end to end.
You should now have a final shortlist. No expiration secretly crosses an earnings date, and every remaining ticker has passed the “would I actually own this” test in writing, not just in your head.
What you should see: annualized return on collateral for your final candidates
For each contract left on your list from step 4, add four numbers. These let you compare candidates side by side using real math, not a gut feeling.
Collateral required. Strike price times 100. Collateral is the cash your broker holds back to cover the put. A $40 strike needs $4,000 in collateral.
Credit received. Premium times 100. Use the bid price, or a realistic mid-price between bid and ask.
Return on collateral. Credit divided by collateral. This is your raw return for the whole trade, no matter how long it runs.
Annualized return on collateral. Take that return and multiply it by 365 divided by DTE. DTE means days left until expiration. This stretches the number out so you can compare trades of different lengths side by side.
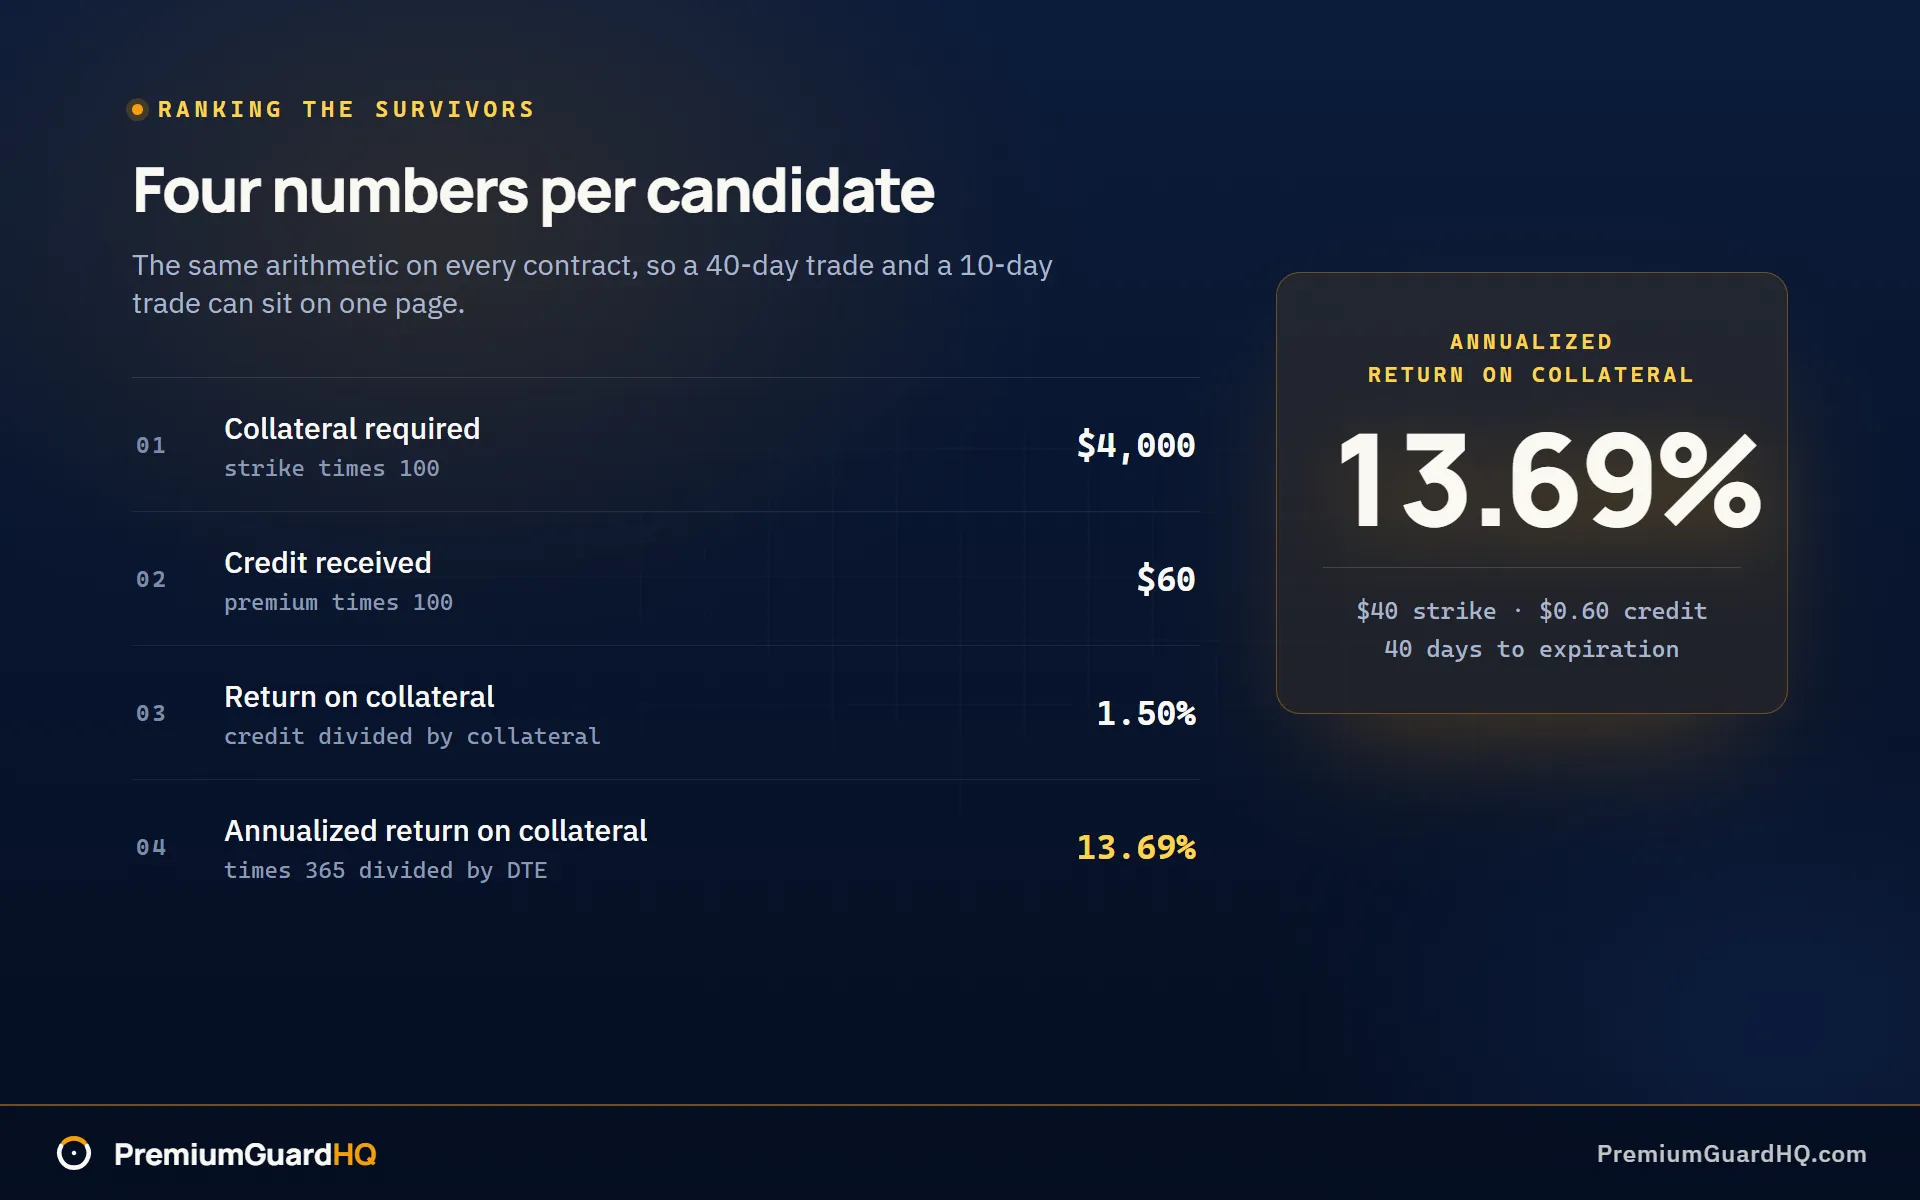
Only compare candidates with the same DTE, unless you are deliberately annualizing to compare across different lengths. A 45-day trade and a 10-day trade can show very different annualized numbers even when the risk looks similar.
Some brokers pay interest on idle cash or cash sitting in a sweep account. This can quietly add to your total return. Check your own account for this, since it varies by broker.
Run these numbers through a tool that will check the collateral and annualized return side by side to confirm your math and your breakeven price.
You should now have 1 to 5 candidates, ranked by annualized return on collateral, with earnings cleared and assignment comfort confirmed.
Frequently asked questions
What is the best cash secured put screener to use?
There is no single best tool. The right screener is whichever one shows five things clearly: bid and ask price, volume, open interest, delta, and implied volatility or IV Rank. Your broker’s own option chain often covers all five. A Barchart-style options screener works too, and so do several free web screeners. Pick whichever view is easiest for you to read every week, then apply the four filters from this guide on top of it. One note on PremiumGuardHQ: it does not screen or rank stocks for you. It tracks and reconciles the puts you have already sold, so you would use a screener first and bring the trade to PGHQ after.
Can this screen work for selling weekly cash secured puts?
Yes, but tighten two things first. Weekly puts expire much faster, so shrink your DTE baseline from 30 to 45 days down to 5 to 10 days, and hold your liquidity and event checks to a stricter standard. Faster decay, meaning the option loses value quicker as it nears expiration, can pay you faster too. But a shorter window also gives you less time to recover if the stock drops, and it makes you more sensitive to a sudden overnight gap in price. Run the same four filters, just on a tighter clock.
Is IV Rank the same thing as implied volatility?
No. Implied volatility, or IV, is the market’s current guess at how much a stock will move. IV Rank compares today’s IV to that same stock’s own IV over the past year, usually on a scale of 0 to 100. A stock that always moves a lot will always show a high raw IV number, even on a boring day. IV Rank fixes that by measuring the stock against its own history. This is why Step 3 uses IV Rank, not raw IV, to avoid selling premium that only looks rich compared to other tickers, when it’s actually cheap for that ticker’s own history.
Do I earn interest on cash collateral while a CSP is open?
It depends on your broker and how your account handles idle cash. Collateral is the cash set aside to cover your put if you get assigned. Some brokers pay interest on that cash automatically through a sweep account, which is where uninvested cash sits until you use it. Others do not, or only pay interest above a certain balance. Check your own broker’s cash sweep policy and how it treats cash held for options collateral specifically. If interest applies, treat it as a separate line item in your results, not something you fold into the option’s annualized return formula.