
Serious options trading requires precise numbers, but your homemade covered call tracking spreadsheet is likely lying to you. Most templates break during rolls or assignment, which hides your true adjusted cost basis and your real cycle income.
Manual Excel sheets do eventually bottleneck as trade volume and roll frequency climb, but you can get the bookkeeping right today. Here are seven formulas that survive real-world execution, starting with the calculation most sheets get wrong: your running net basis.
1. Campaign-level basis tracking without the roll “reset”
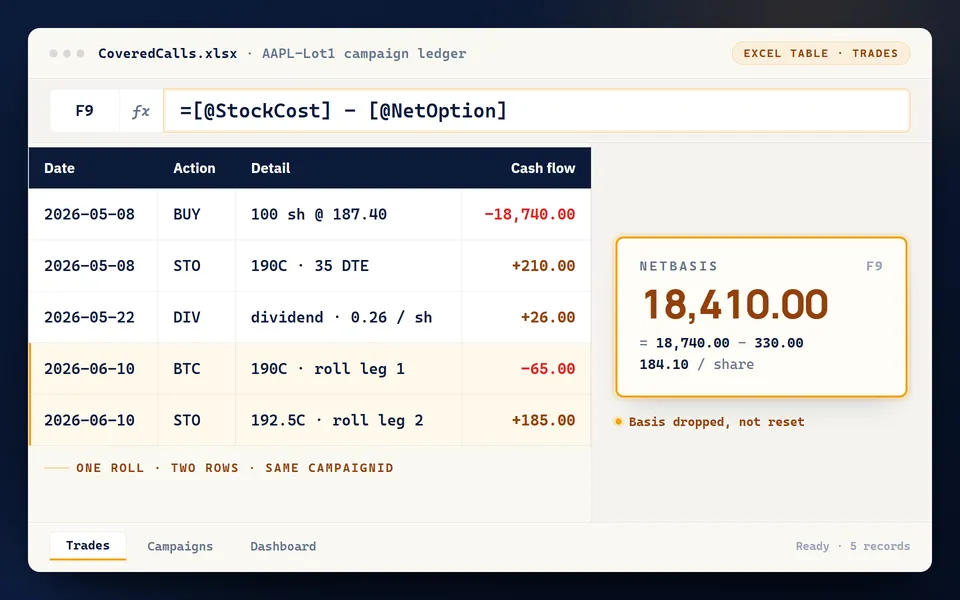
The moment you roll a covered call, most tracking spreadsheets break. Standard templates treat rolls as isolated trades, which either resets your cost basis or double-counts the premium. The fix is to center the sheet on a campaign ledger at the ticker level, with a unique CampaignID (such as AAPL-Lot1) that follows the position through its entire lifecycle.
First, establish one non-negotiable sign convention: credits are positive and debits are negative, in a single OptCashFlow column. If you cannot explain your sign convention in one sentence, the sheet will drift into fiction.
Your ledger needs eight core columns:
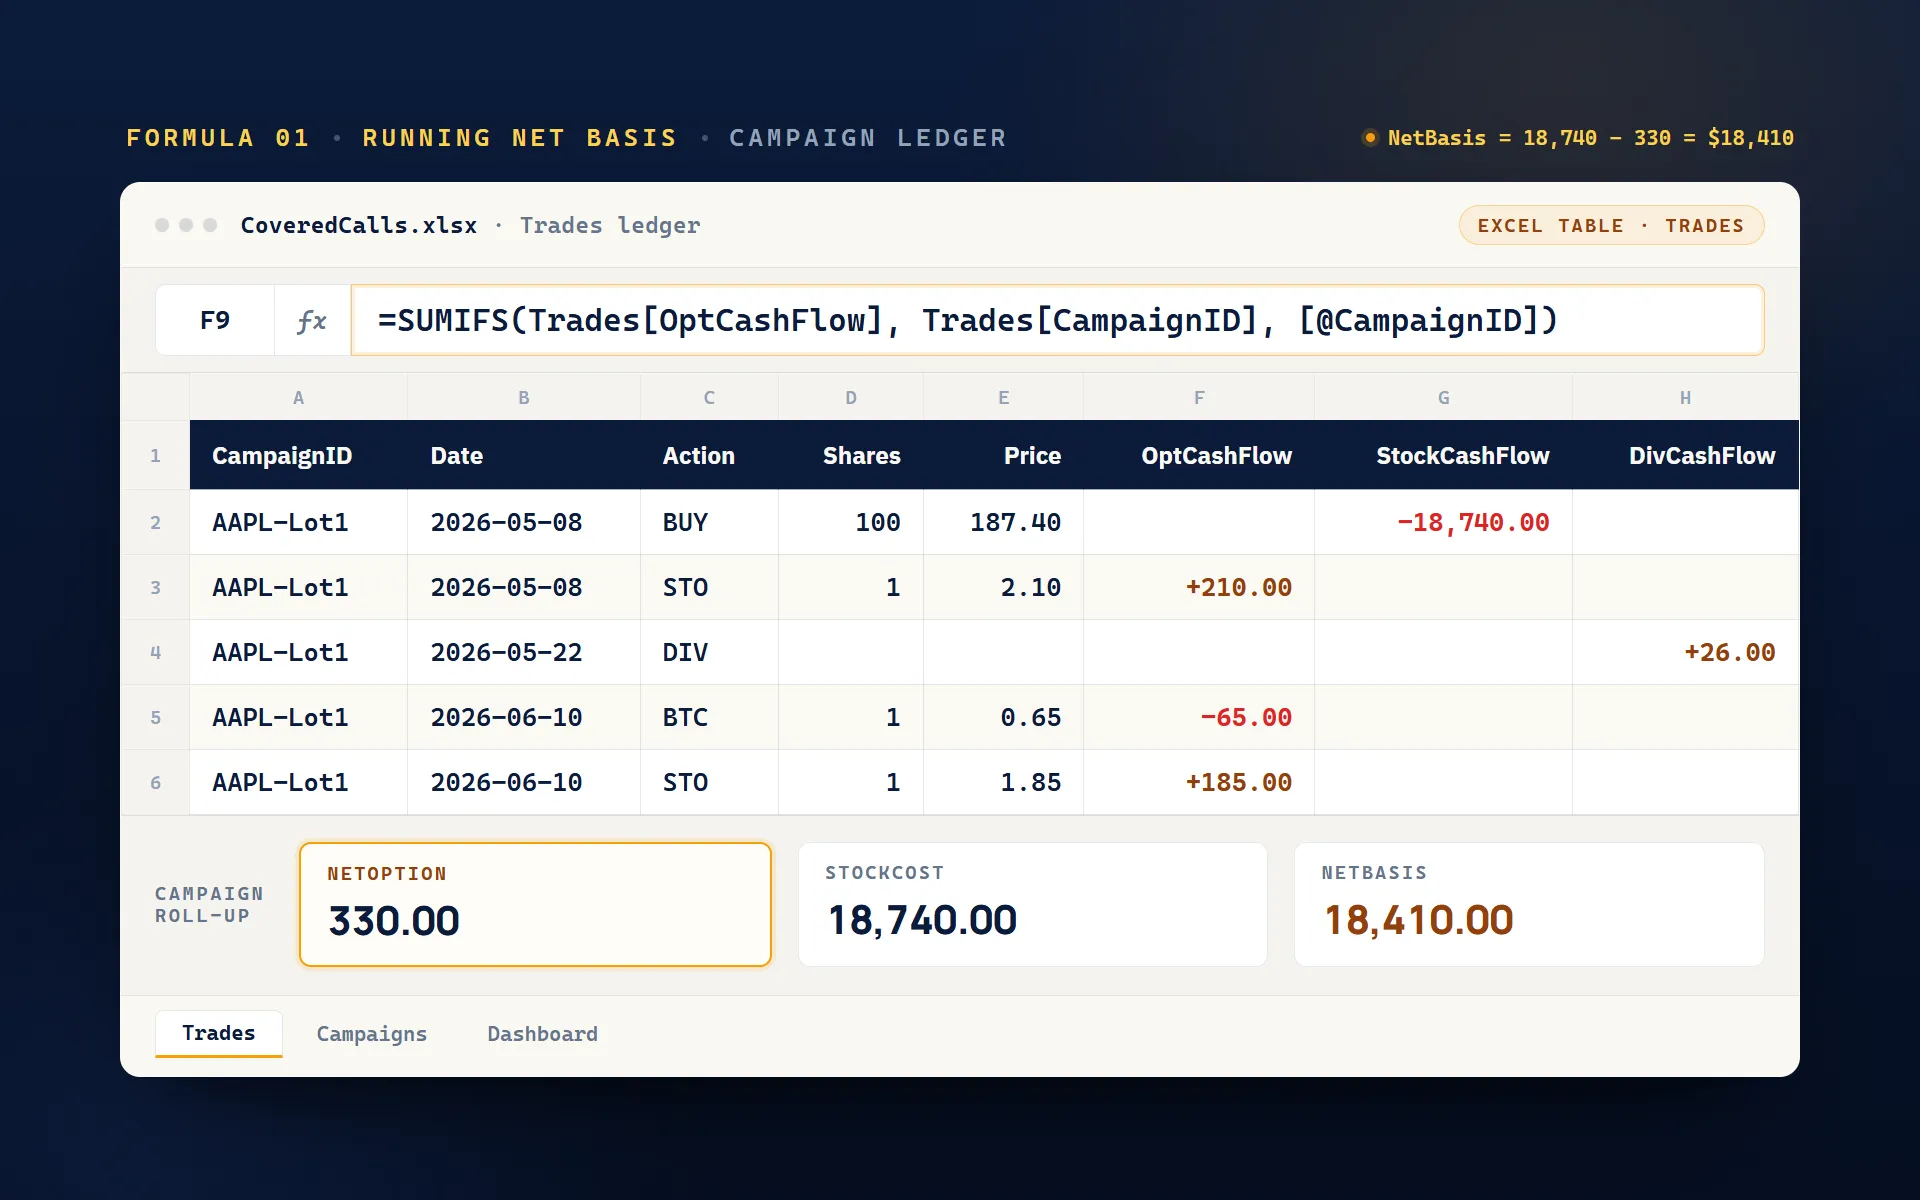
CampaignIDDateAction(STO, BTC, ASSIGN, BUY)SharesPriceOptCashFlowStockCashFlowDivCashFlow
On your summary tab, aggregate the metrics per campaign using these exact formulas:
NetOption = SUMIFS(Trades[OptCashFlow], Trades[CampaignID], [@CampaignID])
StockCost = -SUMIFS(Trades[StockCashFlow], Trades[CampaignID], [@CampaignID])
NetBasis = StockCost - NetOption
A roll is then logged as just two consecutive rows: a BTC debit and an STO credit. If the roll yields a net credit, your basis drops. If you roll for a net debit, your basis rises. The math holds through dozens of rolls.
2. Break-even math that audits your defensive rolls
Campaign-level break-even deserves its own column. If you only watch raw premium captured, you get accidental “income wins” that mask capital erosion. Break-even is the exact share price where the campaign is flat after option premiums and dividends.
Pull these inputs from your campaign summary:
NetBasis(cumulative cost basis)SharesHeld(active stock position)DivTotal(optional separate dividend income)
If you track dividends separately, adjust your basis first:
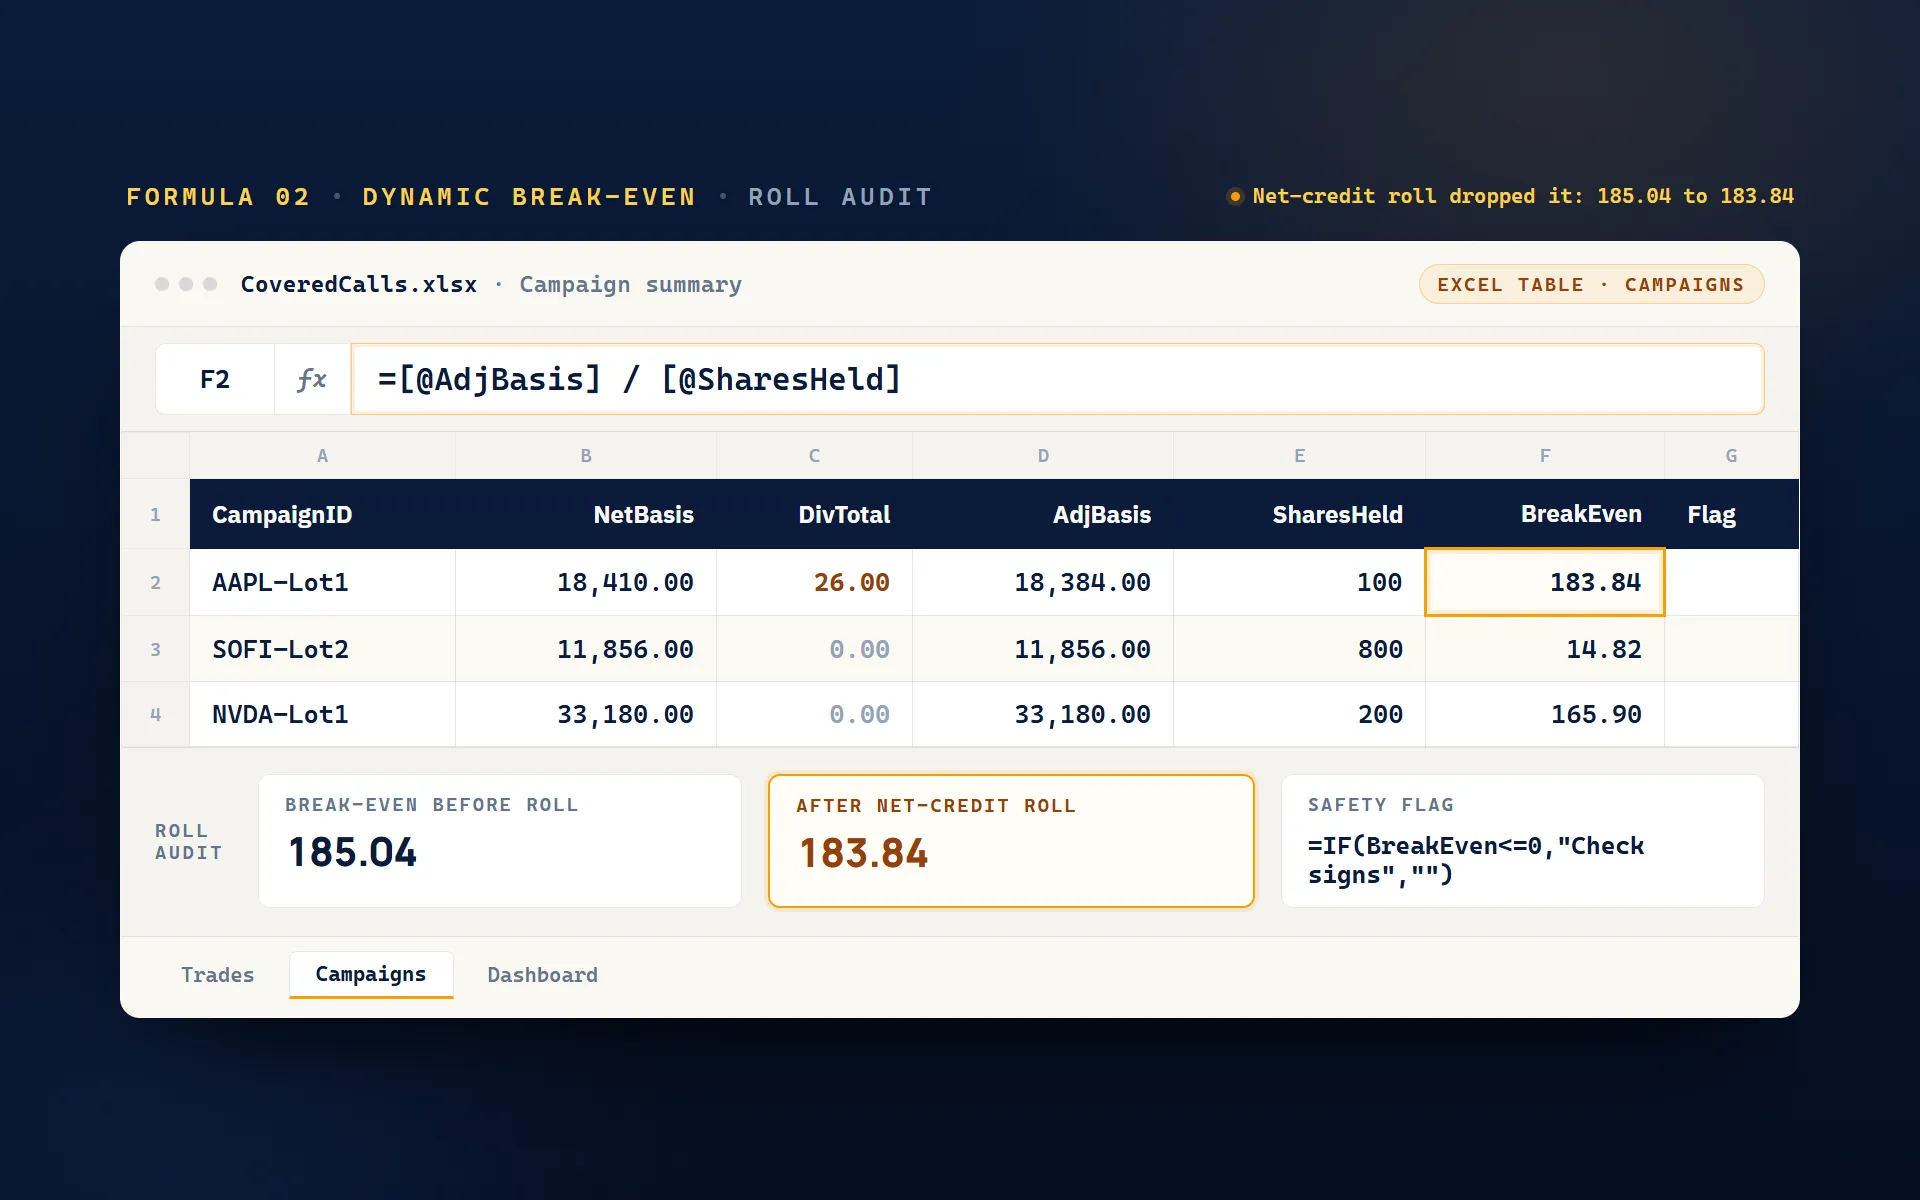
AdjBasis = NetBasis - DivTotal
Compute your true break-even price:
BreakEven = AdjBasis / SharesHeld
If you run a static 100 shares, this calculation is straightforward. If you scale positions, add shares, or sell partial lots, the denominator has to track your current share count.
Add this safety flag to catch sign convention errors:
=IF(BreakEven<=0,"Check signs","")
Use this metric to audit defensive moves. When rolling down a covered call to defend a falling stock, your break-even must move lower if you collect a net credit. If the break-even does not drop, the roll failed to improve your position.
3. Dual-yield projections: premium vs. capital gains
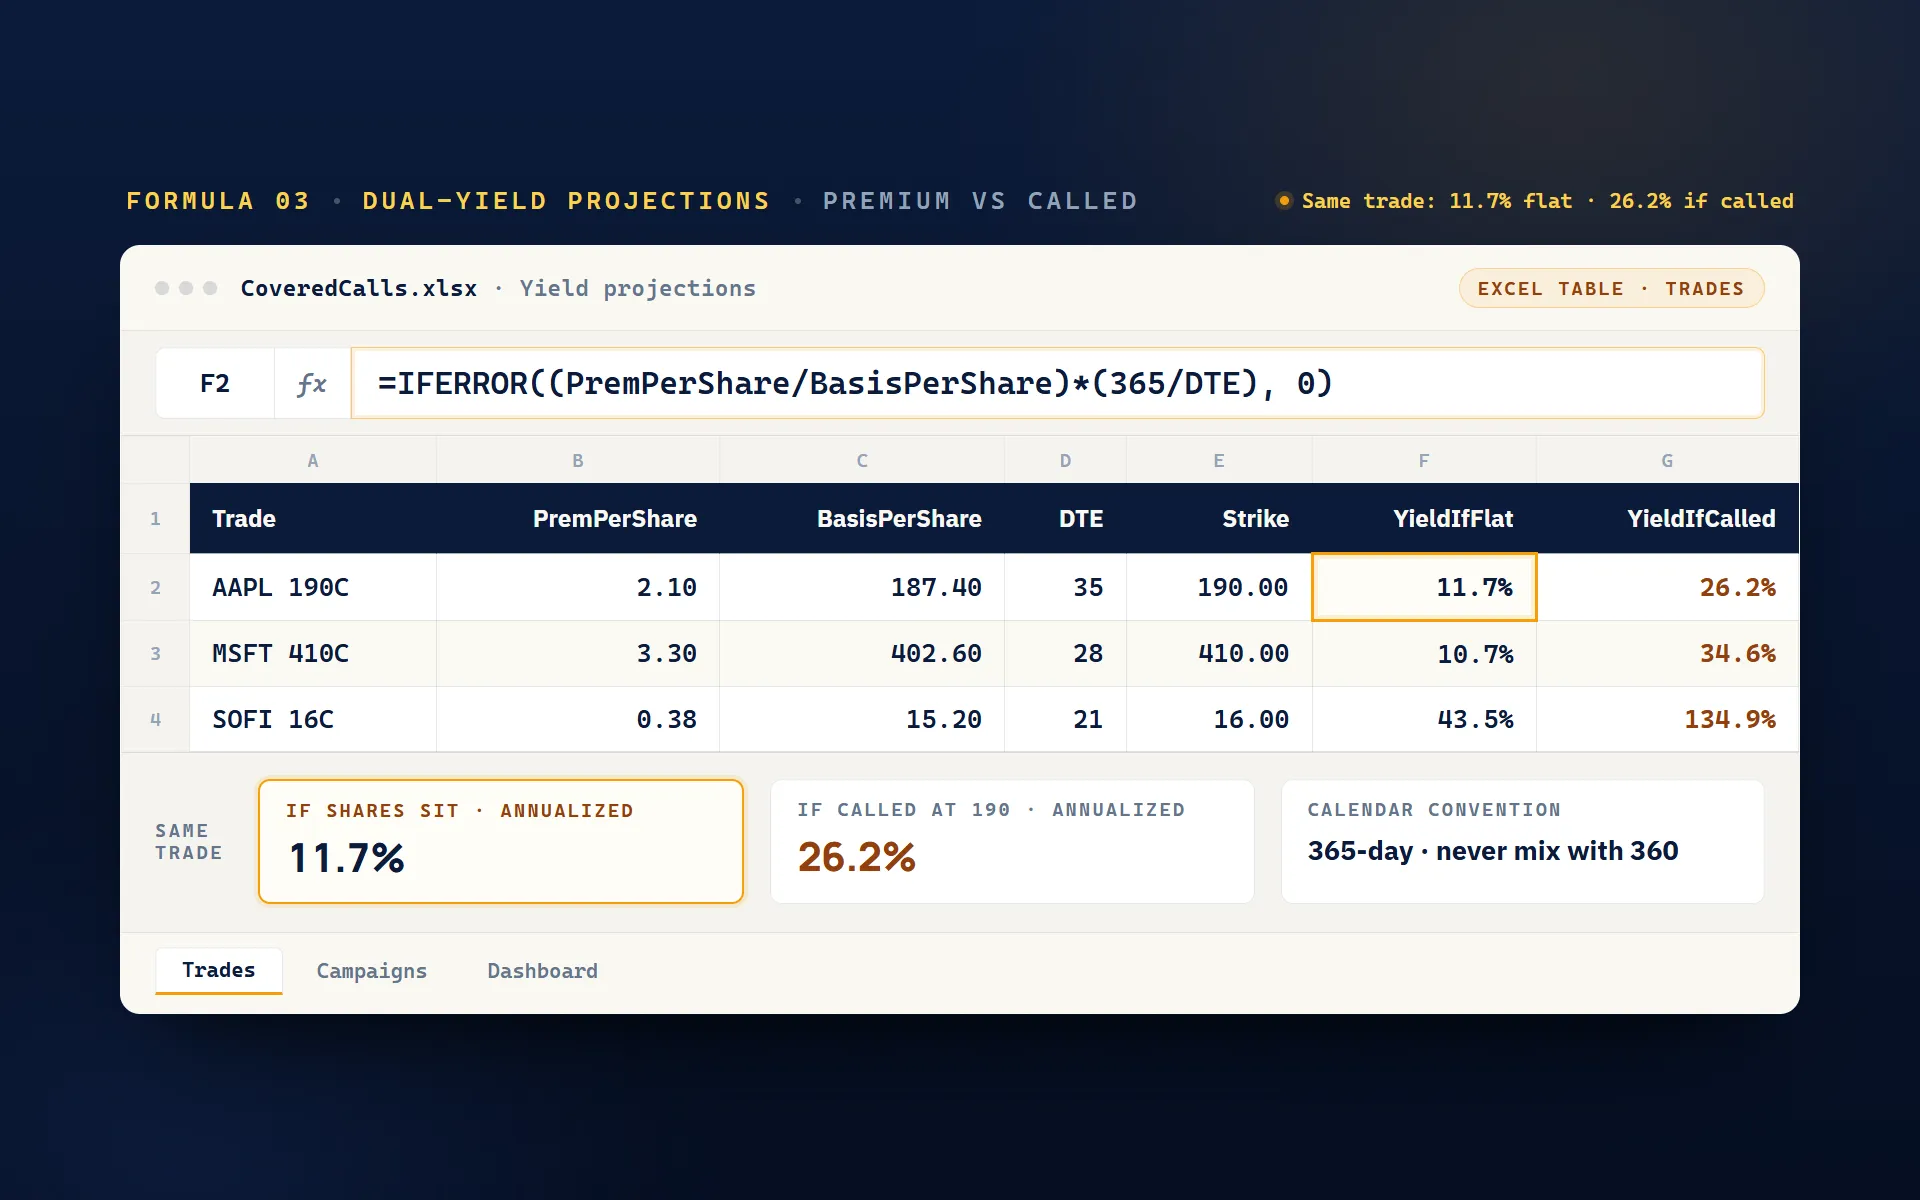
Your sheet needs to separate what you earn if nothing happens from what you earn if shares are called. Mix the two and you get an analytical blind spot that distorts capital allocation. To calculate true standardized yields, map these four inputs in your trade row: PremPerShare, BasisPerShare, DTE, and Strike.
Calculate your premium-only annualized return using the calendar method:
=(PremPerShare/BasisPerShare)*(365/DTE)
If shares are called, use this formula to capture both premium and stock capital gains up to the strike:
=((PremPerShare + (Strike - BasisPerShare))/BasisPerShare)*(365/DTE)
Define your BasisPerShare denominator carefully to keep metrics consistent. If you run an ongoing campaign ledger, use your current adjusted campaign break-even, which stays conservative for multi-cycle positions. If you track raw purchase basis separately, use raw basis across the entire sheet.
A note on calendar conventions: institutional models sometimes use a 360-day year while retail sheets use 365. Pick one standard and keep it consistent across every formula.
To sanity-check your outputs, run the same position through the free covered call calculator. It uses the 365-day convention, so your premium-only and if-called formulas should land on its numbers exactly.
Finally, prevent division-by-zero errors when DTE is blank or zero during weekend setups. Wrap your calculations in an IFERROR() statement to keep your dashboard clean:
=IFERROR((PremPerShare/BasisPerShare)*(365/DTE), 0)
4. Closed-cycle realized profit: when premium is actually earned
If you treat open trade premium as banked cash, your sheet is setting you up for a silent drawdown. In a disciplined trading operation, premium remains unearned until the campaign cycle is fully closed.
For this ledger, a closed cycle means your shares are sold (either called away or manually liquidated) and no short call remains open for that campaign.
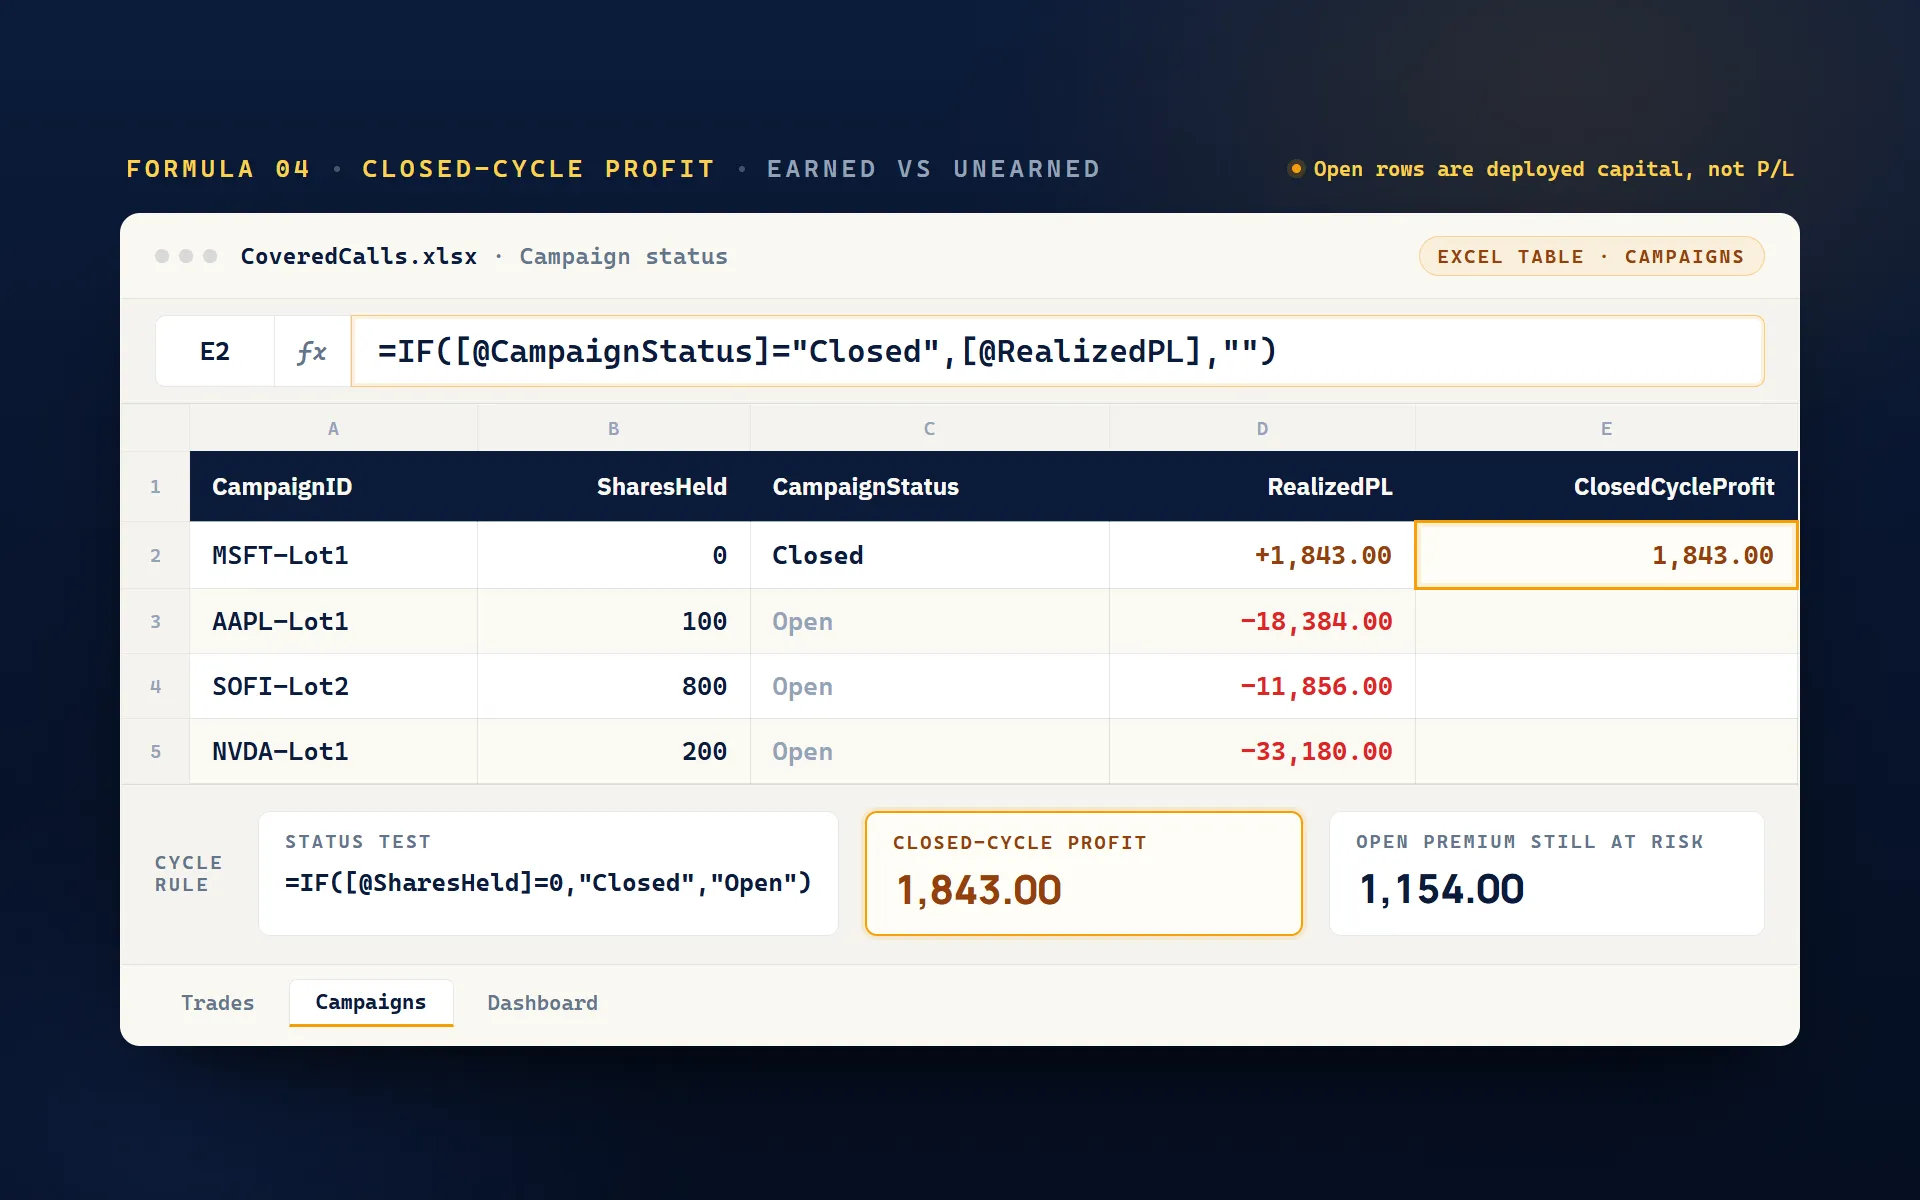
First, compute the active status of your campaign in your summary table:
=IF([@SharesHeld]=0,"Closed","Open")
Next, calculate realized P/L at the campaign level by summing your reconciled cash flows:
- Realized stock:
=SUMIFS(Trades[StockCashFlow], Trades[CampaignID], [@CampaignID])(sales positive, buys negative) - Realized options:
=SUMIFS(Trades[OptCashFlow], Trades[CampaignID], [@CampaignID]) - Realized dividends:
=SUMIFS(Trades[DivCashFlow], Trades[CampaignID], [@CampaignID]) - Realized P/L:
=[@RealizedStock] + [@RealizedOptions] + [@RealizedDiv]
To prevent unearned premium from inflating your performance metrics, add a Closed-Cycle Profit column using this logical filter:
=IF([@CampaignStatus]="Closed",[@RealizedPL],"")
This isolates a clean, realized P/L figure that does not mix open, at-risk premium with active stock exposure. Open premium can easily be reversed by a defensive roll or a severe stock drawdown. Closed-cycle profits cannot.
5. Reconciled monthly income: hard cash flow, not vibes
Most traders track monthly income on a vibe by logging premium when they open a trade. In a professional trading business, income is recognized only when a transaction actually settles.
Define realized income strictly on the transaction date:
- Option credits on Sell-to-Open (STO)
- Net credits on rolls
- Dividends (optional)
First, add a helper column in your Trades table named Month to group your transactions:
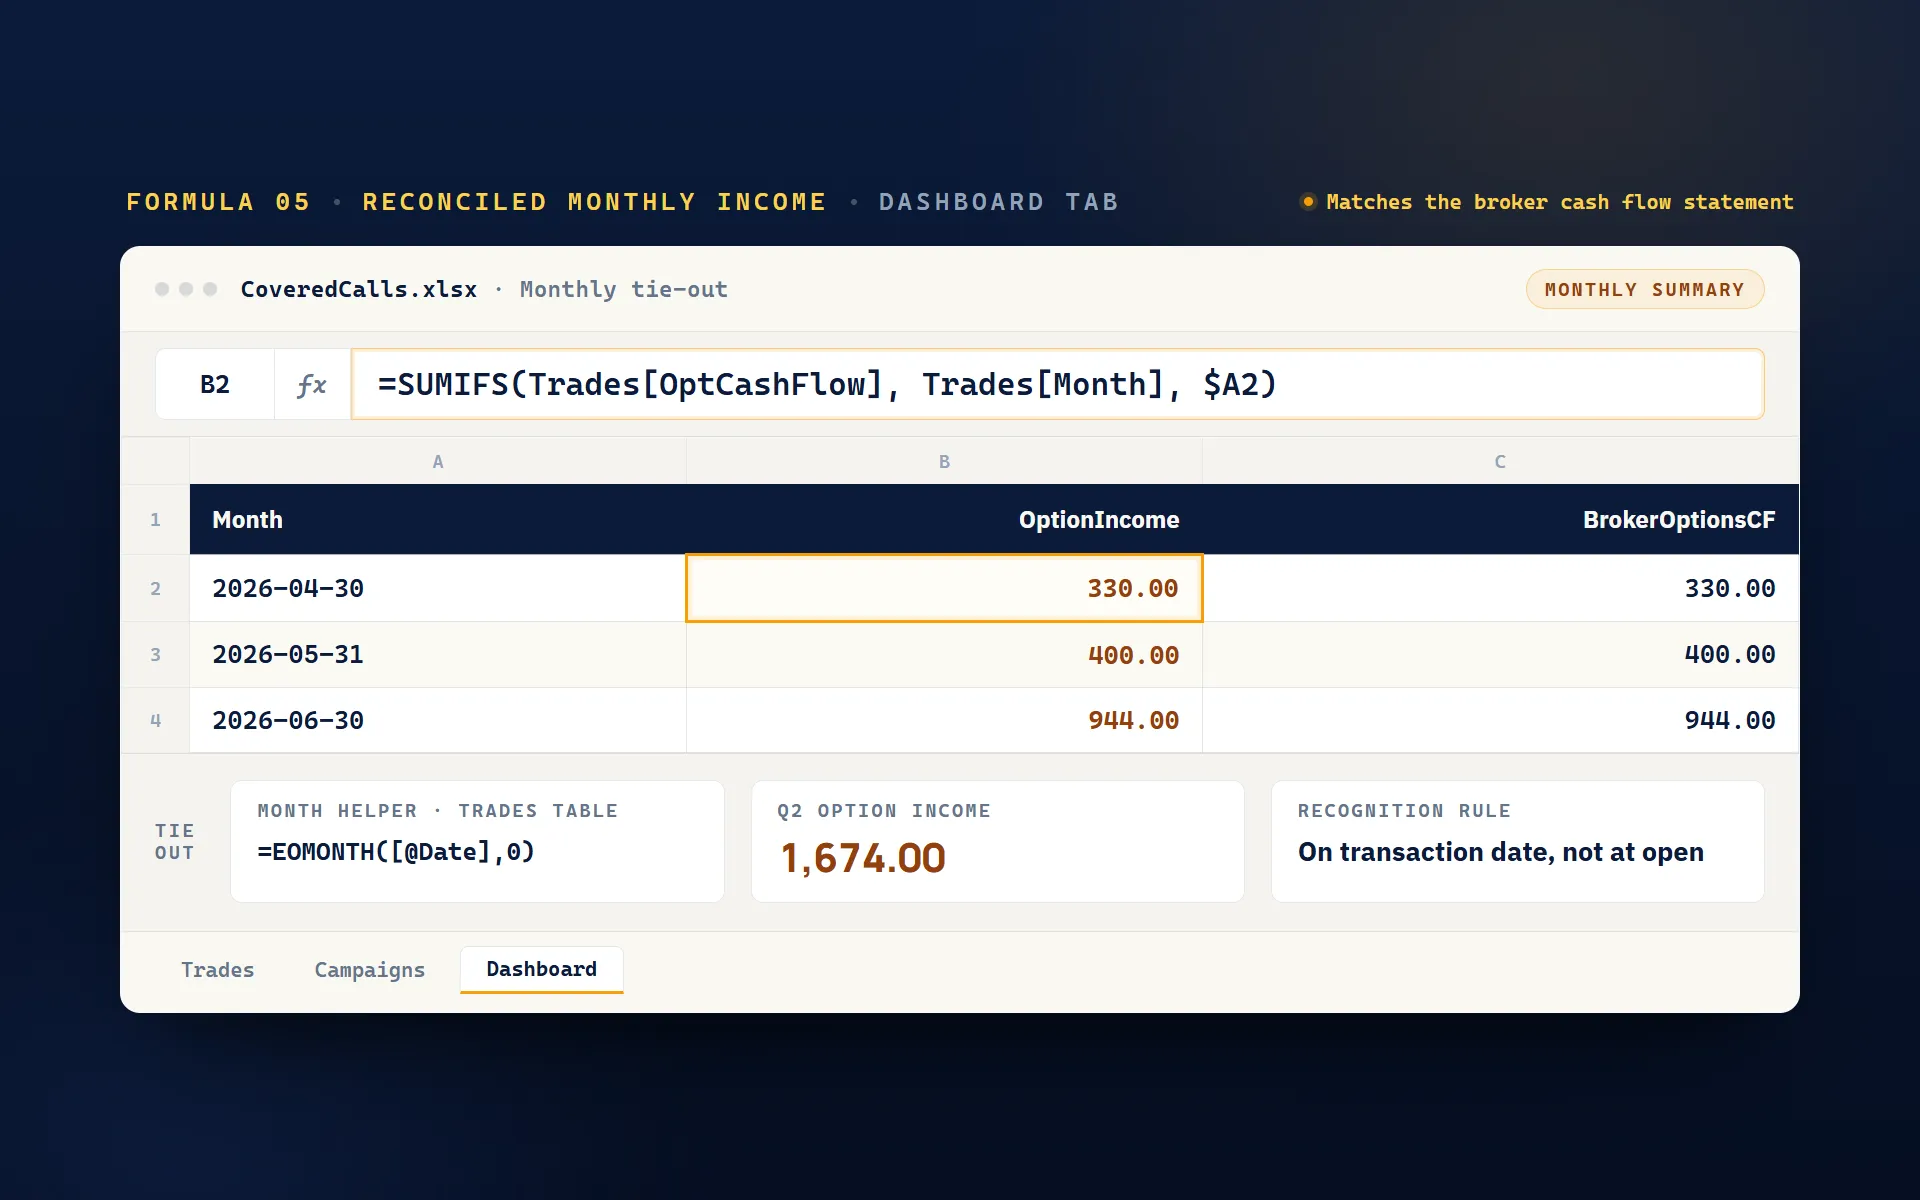
Month = EOMONTH([@Date],0)
On your monthly summary tab, where cell $A2 holds the month-end date, extract your premium-only income using this formula:
=SUMIFS(Trades[OptCashFlow], Trades[Month], $A2)
For a pure premium view, keep your formula focused on option cash flows. For net cash flow, construct a second line for stock transactions. If you prefer to track earned premium only when a cycle closes, add a CycleClosedDate column and write your SUMIFS against that field instead.
Never trust a dashboard until you perform a monthly tie-out. Your spreadsheet’s monthly total must reconcile exactly to your broker’s options cash flow statement for that same date range.
6. Premium per day (PPD): pure option income efficiency
Premium per day cuts through the annualization debates. It measures the premium earned per day of holding the short call, so you can compare capital efficiency across expirations without getting lost in annualized metrics or compounding math.
Use these standardized formulas in your tracker:
- Per-share PPD:
=PremPerShare / DTE - Per-contract PPD:
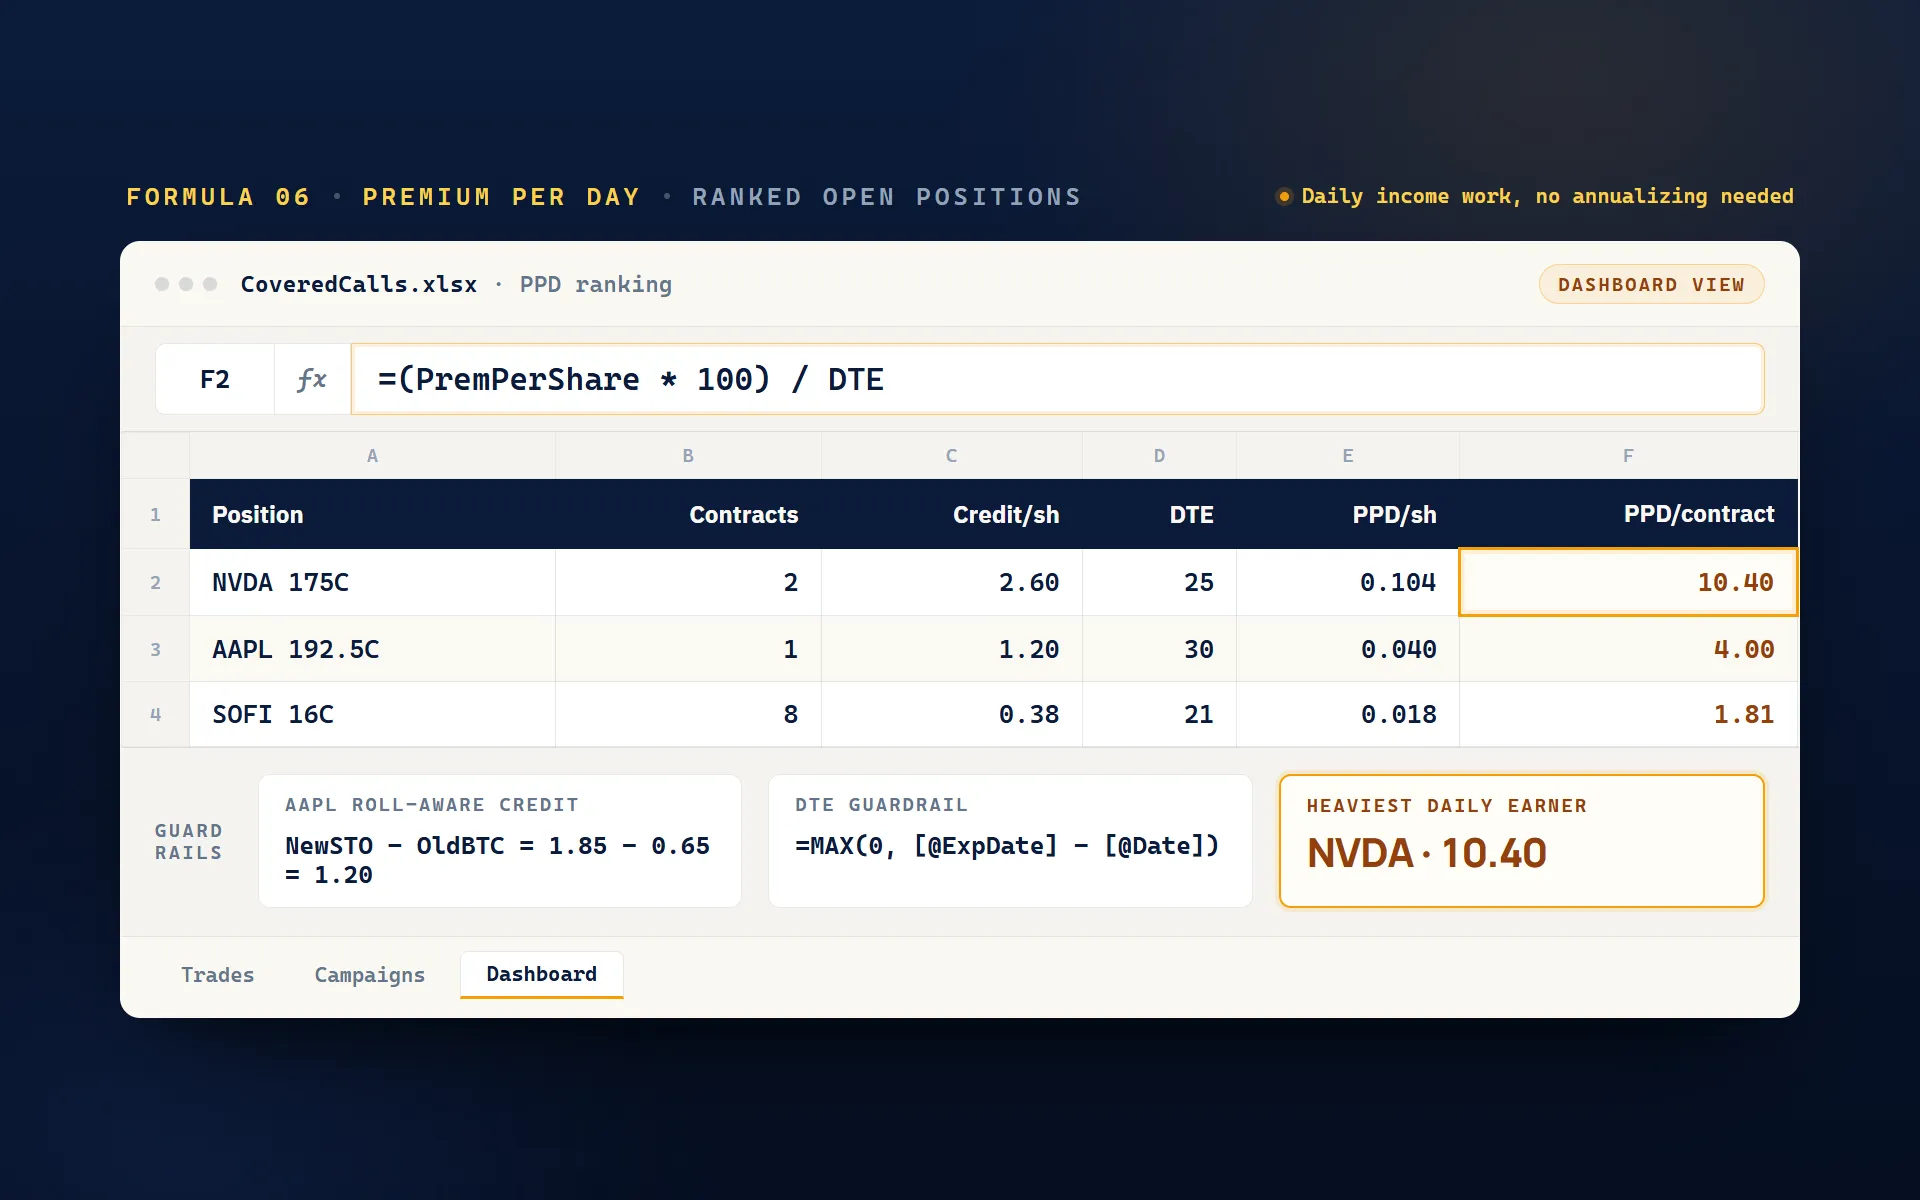
=(PremPerShare * 100) / DTE
When rolling a position, use a roll-aware calculation that accounts for the cost of closing your current trade. On the roll date, compute your net credit first:
NetRollCreditPerShare = NewSTO - OldBTC
Then compute the updated daily efficiency:
PPD = NetRollCreditPerShare / NewDTE
Inside your dashboard, rank open positions by PPD. The ranking shows which underlying tickers do the heaviest income work per day, and that makes the next capital allocation decision easier.
Finally, establish a QA guardrail so your DTE does not drift. Because Excel stores dates as serial numbers, calculate remaining duration automatically:
=MAX(0, [@ExpDate] - [@Date])
DTE then scales down cleanly toward expiration instead of going stale in the sheet.
7. Allocation controls that stop concentration drift
The biggest risk to your trading business is rarely a single bad trade. It is the slow drift from your own risk caps when chasing juicy premiums.
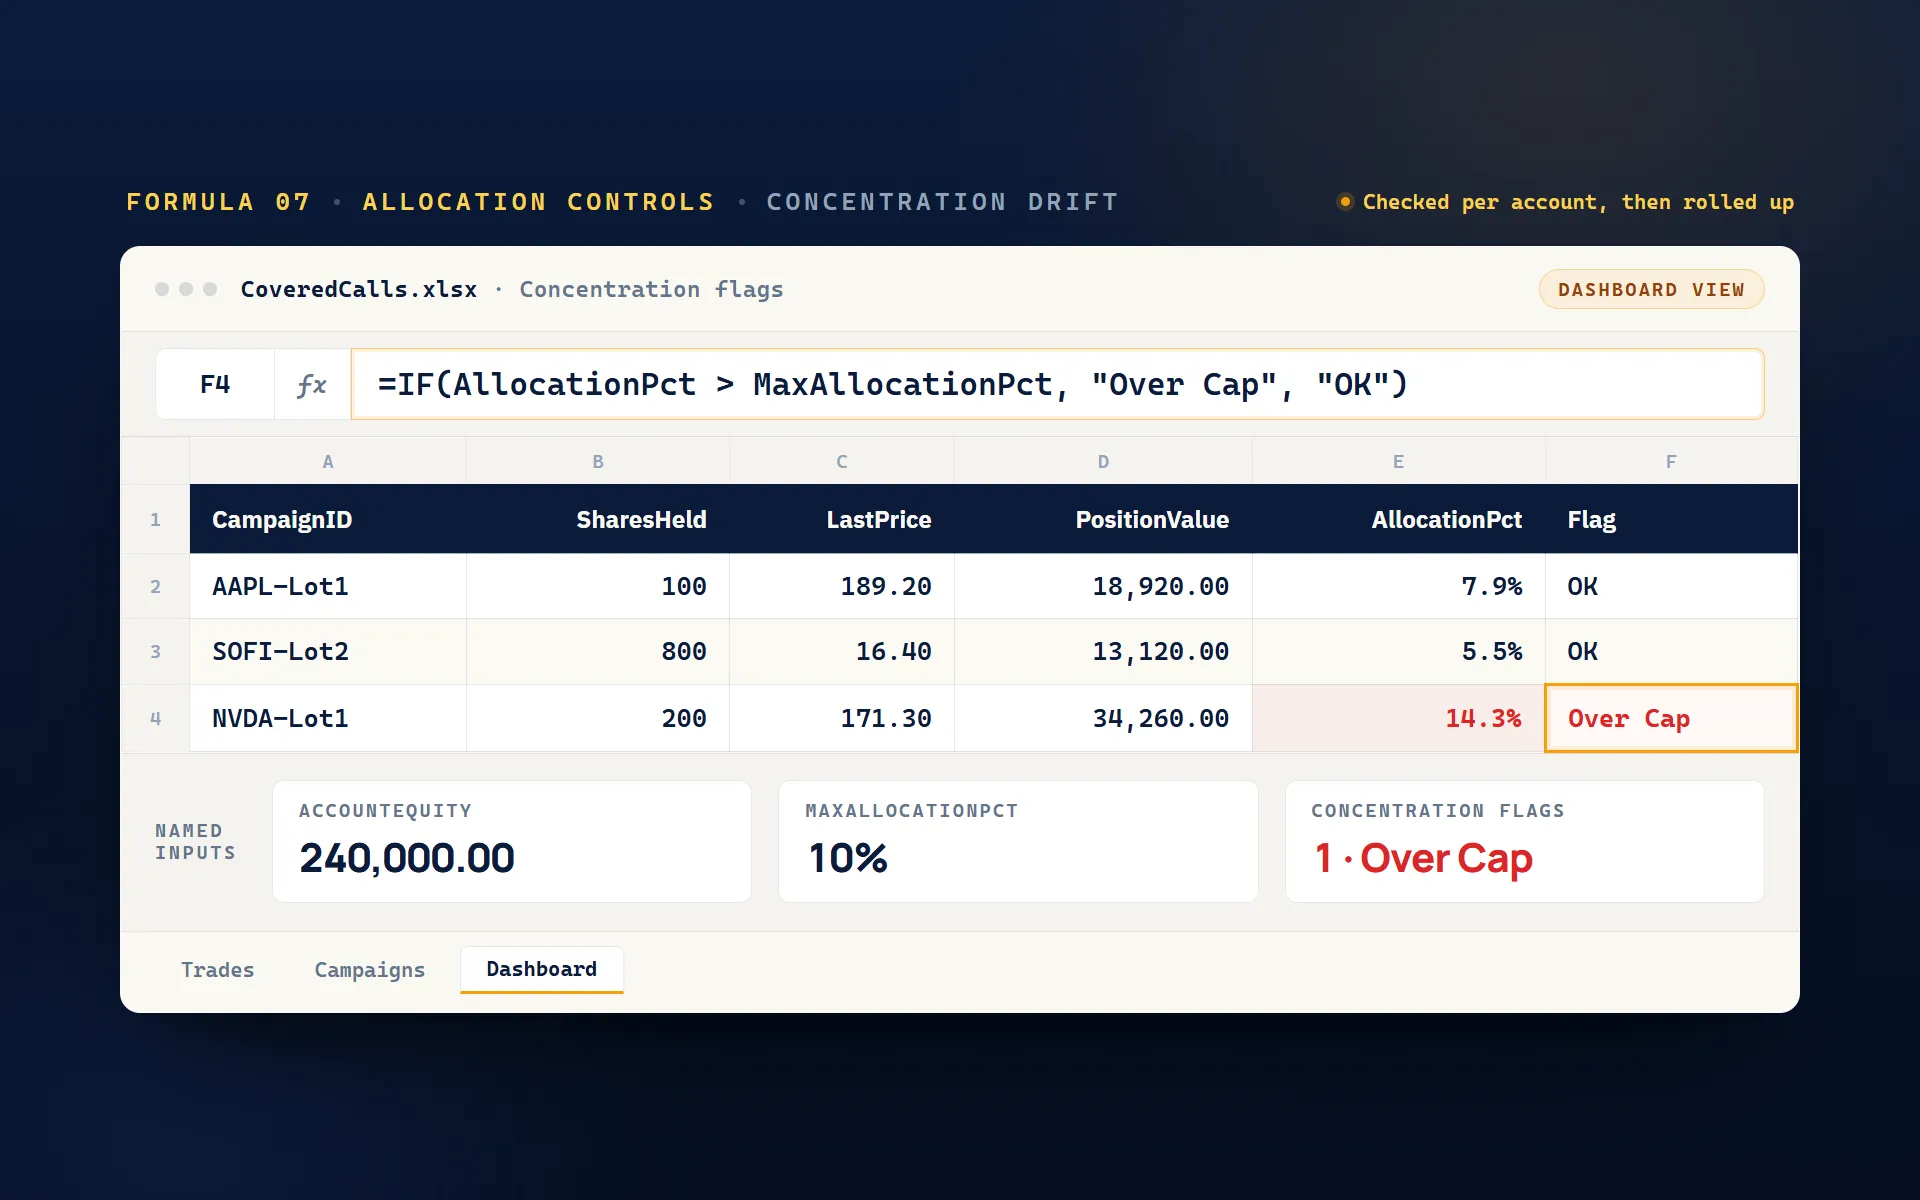
To build strict portfolio-level controls into your covered call tracking spreadsheet, establish two global named inputs on your summary sheet:
AccountEquity: your total liquidated net asset value.MaxAllocationPct: your limit per position (e.g., 0.10 for a 10% cap).
Inside your active campaigns ledger, track current position value and weight using these formulas:
- Position value:
=SharesHeld * LastStockPrice - Allocation percent:
=PositionValue / AccountEquity
Then write a logical test to flag concentration creep automatically, without manual scanning:
=IF(AllocationPct > MaxAllocationPct, "Over Cap", "OK")
If you trade across multiple accounts, run this math per account first before building a second roll-up view. Mixing accounts early is how spreadsheets hide localized concentration.
Finally, remember that options premium is not a hedge. Five covered calls on highly correlated tech stocks just package one concentrated market bet into several smaller columns.
How to build a bulletproof covered call tracking spreadsheet
1. The minimum viable workbook structure
Configure the workbook with three tabs, and convert your transaction log into an Excel Table so references stay stable and formulas fill automatically:
Tradestab: log one row per transaction in this append-only ledger.Campaignstab: useSUMIFSformulas to pull aggregated totals per ticker campaign.Dashboardtab: track monthly income, active capital at risk, and concentration flags.
2. Strict data hygiene rules
Manual inputs corrupt formulas. Enforce these rules to prevent spreadsheet drift:
- Protect calculated columns: never overwrite formulas with manual entries. Record exceptions as new rows.
- Validate inputs: restrict your
Actioncolumn to STO, BTC, BUY, SELL, and ASSIGN using Data Validation. - Isolate cash flows: separate stock transactions, options premiums, and dividends into independent columns.
3. CSV import workflow and the complexity ceiling
To update your ledger, establish a consistent import routine:
- Export your broker transaction history as a CSV file.
- Paste this raw data into a temporary staging tab.
- Normalize and copy the columns into your
Tradesledger, using Power Query if available.
This manual setup works reliably at low volumes. However, you will eventually hit a complexity ceiling. Once your strategy involves frequent rolls, partial lots, or multiple accounts, spreadsheet reconciliation becomes a second job.
To bypass manual tagging and formula drift, PremiumGuardHQ automates this entire pipeline. We read your broker data overnight to generate clean, campaign-level math.
Frequently asked questions
Can Google Sheets GOOGLEFINANCE() pull option prices?
No. The native GOOGLEFINANCE() function cannot retrieve options data. To pull option chains, you must use paid add-ons, link to a broker API, or write a custom script that pulls JSON data. Avoid scraping data with IMPORTXML because external website layout changes will constantly break your formulas.
What is the cleanest way to record an option roll?
Log the roll as two distinct transactions: a Buy-to-Close (debit) row and a Sell-to-Open (credit) row. Tie both transactions to the same CampaignID. Let your sign convention handle the basis adjustments naturally, and never edit historical rows.
Should I track raw assignment prices or my broker’s adjusted basis?
Track raw assignment prices. Brokers adjust displayed cost basis for wash sales and premiums, which distorts your performance metrics. Logging raw fills keeps premiums as a separate, clean cash flow stream so your ledger matches your actual broker statements.
Should I use 360 or 365 days to annualize my returns?
Either works, but you must standardize. The 365-day method tracks real calendar days, while the 360-day method is an institutional convention. Pick one approach and use it across all of your formulas to keep your performance comparisons accurate.
When should I graduate from spreadsheet tracking?
Move away from spreadsheets when manual reconciliation takes longer than actual trade analysis, or when tracking errors make your ledger untrustworthy. This bottleneck typically happens once you trade across multiple brokers, run several active positions, or roll frequently. If you want automated bookkeeping with zero manual tagging, PremiumGuardHQ connects your accounts and validates your numbers against your real broker fills.